Answered step by step
Verified Expert Solution
Question
1 Approved Answer
Show transcribed image text please answer Q2 ONLY Case study An experienced budget analyst at Technica, Inc., has been charged with assessing the firm's financial
Show transcribed image text
please answer Q2 ONLY
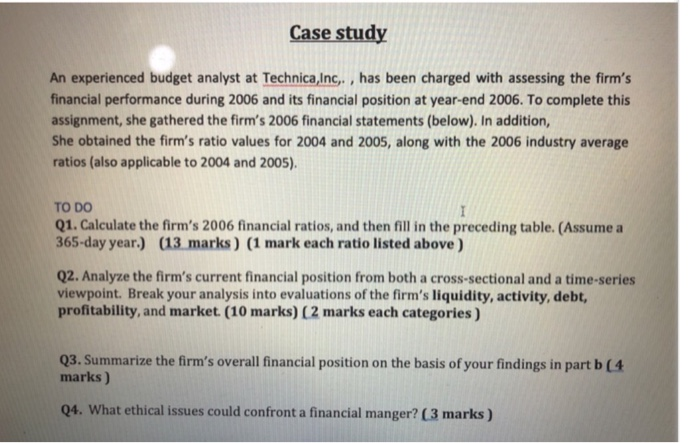
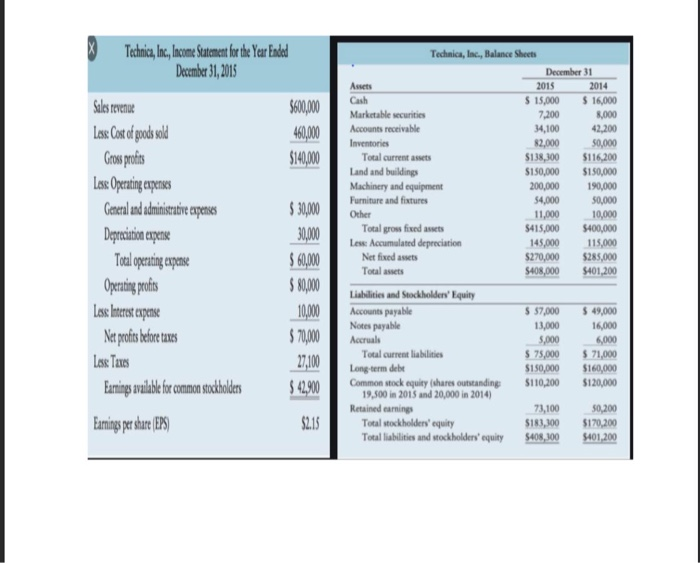
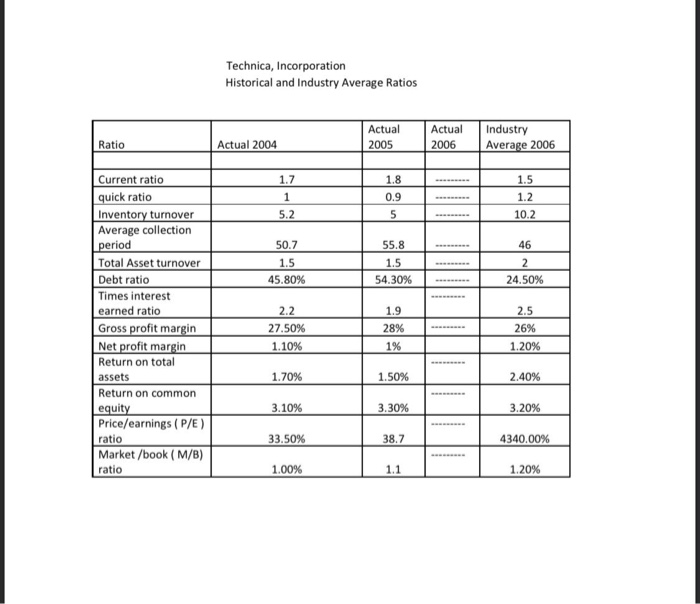
Case study An experienced budget analyst at Technica, Inc., has been charged with assessing the firm's financial performance during 2006 and its financial position at year-end 2006. To complete this assignment, she gathered the firm's 2006 financial statements (below). In addition, She obtained the firm's ratio values for 2004 and 2005, along with the 2006 industry average ratios (also applicable to 2004 and 2005). I TO DO Q1. Calculate the firm's 2006 financial ratios, and then fill in the preceding table. (Assume a 365-day year.) (13 marks) (1 mark each ratio listed above) Q2. Analyze the firm's current financial position from both a cross-sectional and a time-series viewpoint. Break your analysis into evaluations of the firm's liquidity, activity, debt, profitability, and market. (10 marks) (2 marks each categories ) Q3. Summarize the firm's overall financial position on the basis of your findings in part b ( 4 marks ) Q4. What ethical issues could confront a financial manger? (3 marks) Technica, Inc, Income Statement for the Year Ended December 31, 2015 Sales revenue $600,000 Less Cost of goods sold 460,000 Gross profits $140,000 Les Operating expenses General and administrative expenses $ 30,000 Depreciation expense 30,000 Tocal operating expense $ 60,000 Operating profits Less Interest expense 10,000 Net profts before taxes $ 70,000 Less Taxes 27,100 Earnings available for common stockholders $ 42,900 Earnings per share (EPS) $2.15 Technica, Inc., Balance Sheets December 31 Assets 2015 2014 Cash $ 15,000 $ 16,000 Marketable securities 7.200 8,000 Accounts receivable 34,100 42,200 Inventories 82,000 50,000 Total current assets $138,300 $116,200 Land and buildings $150,000 $150,000 Machinery and equipment 200,000 190,000 Furniture and fixtures 54,000 50,000 Other 11,000 10,000 Total grow fixed asset 5415,000 $400,000 Lex Accumulated depreciation 145,000 115,000 Net fixed assets $270,000 $285,000 Total assets $408,000 5401,200 Liabilities and Stockholders' Equity Accounts payable $ 57,000 $ 49,000 Notes payable 13,000 16,000 Accruals 5,000 6,000 Total current liabilities $ 75,000 $ 71,000 Long-term debe $150,000 $160,000 Common stock equity (shares outstanding 5110,200 $120,000 19,500 in 2015 and 20,000 in 2014) Retained earnings 73,100 50,200 Total stockholders' equity $183,300 $170,200 Total liabilities and stockholders' equity $408,300 5401,200 $80,000 Technica, Incorporation Historical and Industry Average Ratios Ratio Actual 2005 Actual 2006 Actual 2004 Industry Average 2006 1.7 1.8 1 5.2 0.9 5 1.5 1.2 10.2 50.7 1.5 45.80% 55.8 1.5 54.30% 46 2 24.50% 1.9 Current ratio quick ratio Inventory turnover Average collection period Total Asset turnover Debt ratio Times interest earned ratio Gross profit margin Net profit margin Return on total assets Return on common equity Price/earnings (P/E) ratio Market/book (M/B) ratio 2.2 27.50% 1.10% 28% 1% 2.5 26% 1.20% 1.70% 1.50% 2.40% 3.10% 3.30% 3.20% 33.50% 38.7 4340.00% 1.00% 1.1 1.20% Case study An experienced budget analyst at Technica, Inc., has been charged with assessing the firm's financial performance during 2006 and its financial position at year-end 2006. To complete this assignment, she gathered the firm's 2006 financial statements (below). In addition, She obtained the firm's ratio values for 2004 and 2005, along with the 2006 industry average ratios (also applicable to 2004 and 2005). I TO DO Q1. Calculate the firm's 2006 financial ratios, and then fill in the preceding table. (Assume a 365-day year.) (13 marks) (1 mark each ratio listed above) Q2. Analyze the firm's current financial position from both a cross-sectional and a time-series viewpoint. Break your analysis into evaluations of the firm's liquidity, activity, debt, profitability, and market. (10 marks) (2 marks each categories ) Q3. Summarize the firm's overall financial position on the basis of your findings in part b ( 4 marks ) Q4. What ethical issues could confront a financial manger? (3 marks) Technica, Inc, Income Statement for the Year Ended December 31, 2015 Sales revenue $600,000 Less Cost of goods sold 460,000 Gross profits $140,000 Les Operating expenses General and administrative expenses $ 30,000 Depreciation expense 30,000 Tocal operating expense $ 60,000 Operating profits Less Interest expense 10,000 Net profts before taxes $ 70,000 Less Taxes 27,100 Earnings available for common stockholders $ 42,900 Earnings per share (EPS) $2.15 Technica, Inc., Balance Sheets December 31 Assets 2015 2014 Cash $ 15,000 $ 16,000 Marketable securities 7.200 8,000 Accounts receivable 34,100 42,200 Inventories 82,000 50,000 Total current assets $138,300 $116,200 Land and buildings $150,000 $150,000 Machinery and equipment 200,000 190,000 Furniture and fixtures 54,000 50,000 Other 11,000 10,000 Total grow fixed asset 5415,000 $400,000 Lex Accumulated depreciation 145,000 115,000 Net fixed assets $270,000 $285,000 Total assets $408,000 5401,200 Liabilities and Stockholders' Equity Accounts payable $ 57,000 $ 49,000 Notes payable 13,000 16,000 Accruals 5,000 6,000 Total current liabilities $ 75,000 $ 71,000 Long-term debe $150,000 $160,000 Common stock equity (shares outstanding 5110,200 $120,000 19,500 in 2015 and 20,000 in 2014) Retained earnings 73,100 50,200 Total stockholders' equity $183,300 $170,200 Total liabilities and stockholders' equity $408,300 5401,200 $80,000 Technica, Incorporation Historical and Industry Average Ratios Ratio Actual 2005 Actual 2006 Actual 2004 Industry Average 2006 1.7 1.8 1 5.2 0.9 5 1.5 1.2 10.2 50.7 1.5 45.80% 55.8 1.5 54.30% 46 2 24.50% 1.9 Current ratio quick ratio Inventory turnover Average collection period Total Asset turnover Debt ratio Times interest earned ratio Gross profit margin Net profit margin Return on total assets Return on common equity Price/earnings (P/E) ratio Market/book (M/B) ratio 2.2 27.50% 1.10% 28% 1% 2.5 26% 1.20% 1.70% 1.50% 2.40% 3.10% 3.30% 3.20% 33.50% 38.7 4340.00% 1.00% 1.1 1.20%Step by Step Solution
There are 3 Steps involved in it
Step: 1

Get Instant Access to Expert-Tailored Solutions
See step-by-step solutions with expert insights and AI powered tools for academic success
Step: 2

Step: 3
Ace Your Homework with AI
Get the answers you need in no time with our AI-driven, step-by-step assistance
Get Started