

Answered step by step
Verified Expert Solution
Question
1 Approved Answer
show what is next questions there are four steps I already show u what is next question will be Construct Pivot Tables showing the counts
show what is next questions
there are four steps I already show u what is next question will be
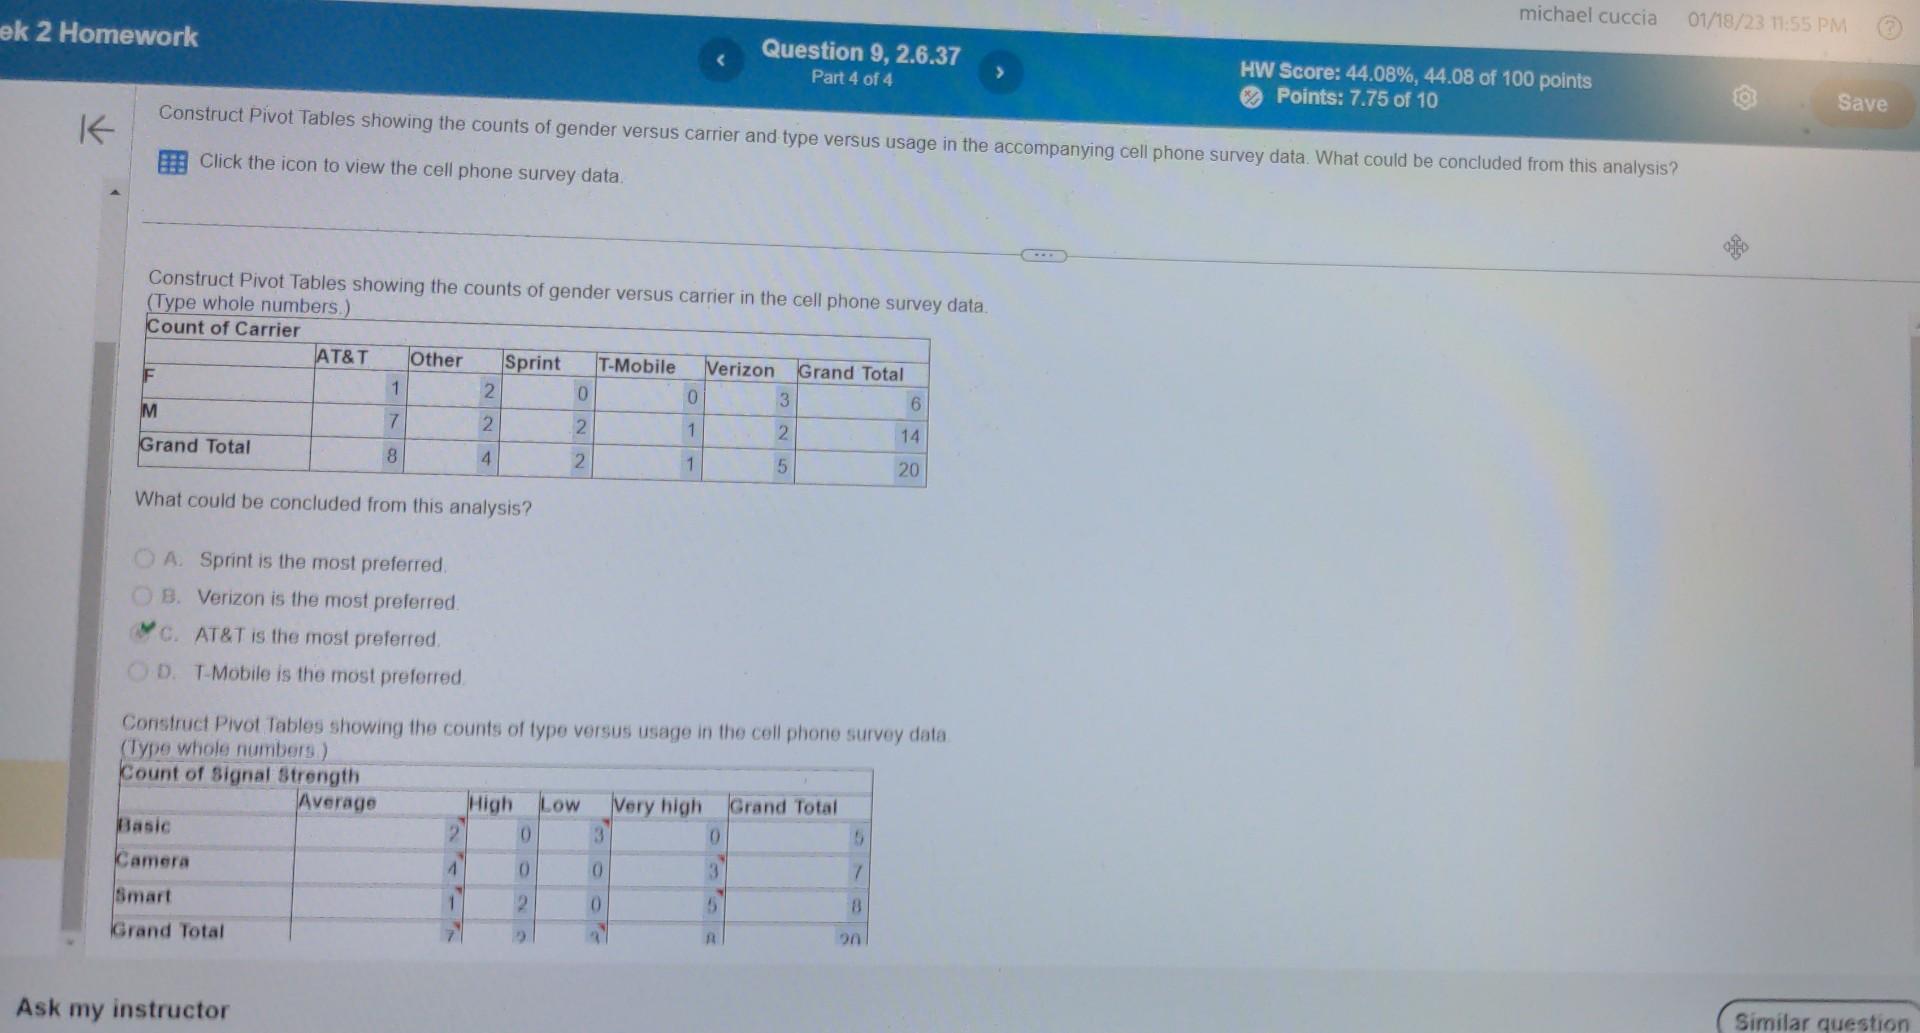
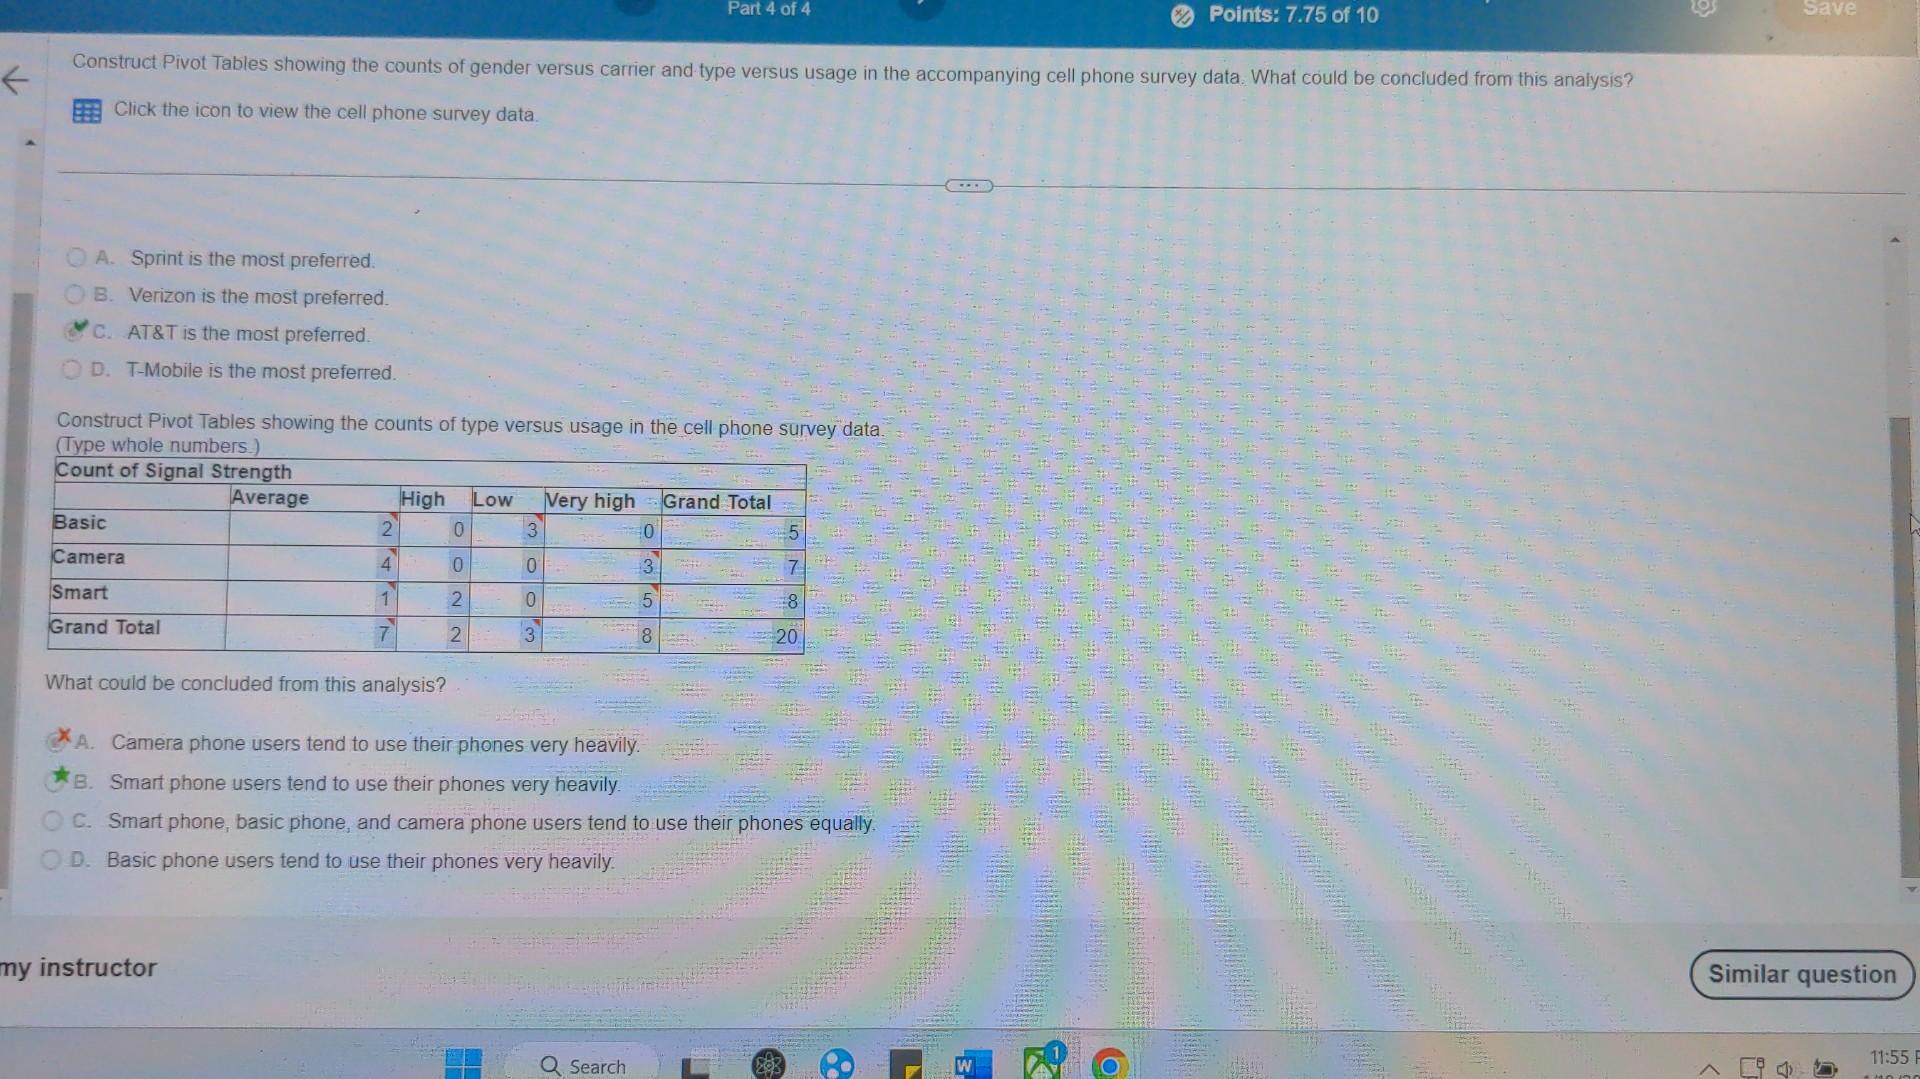
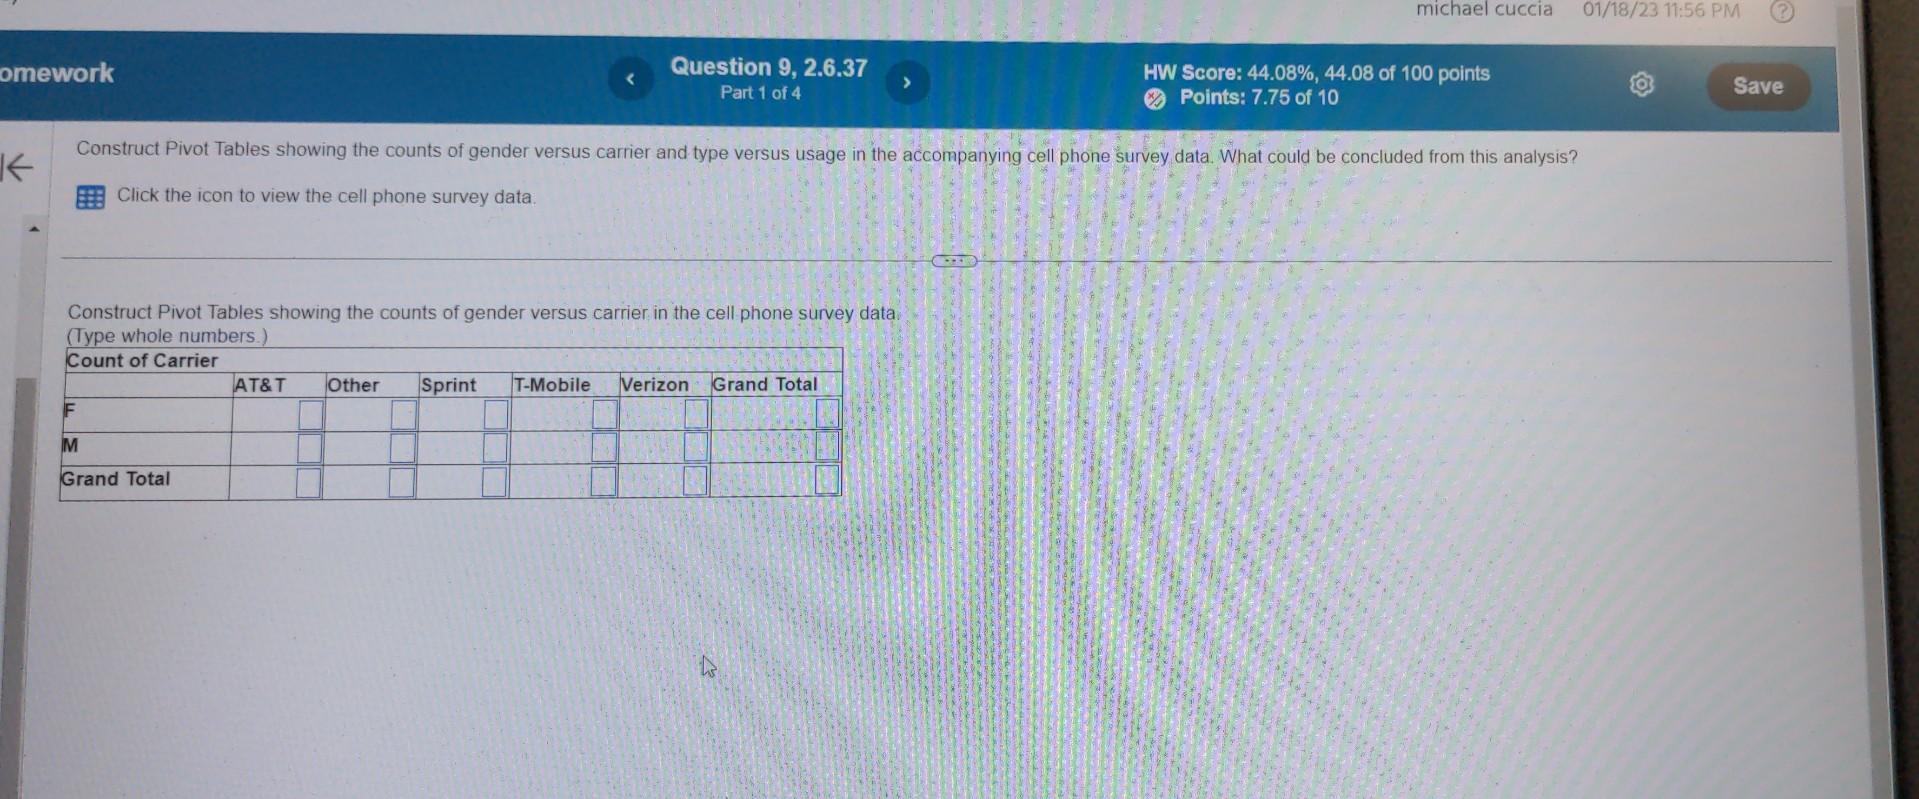
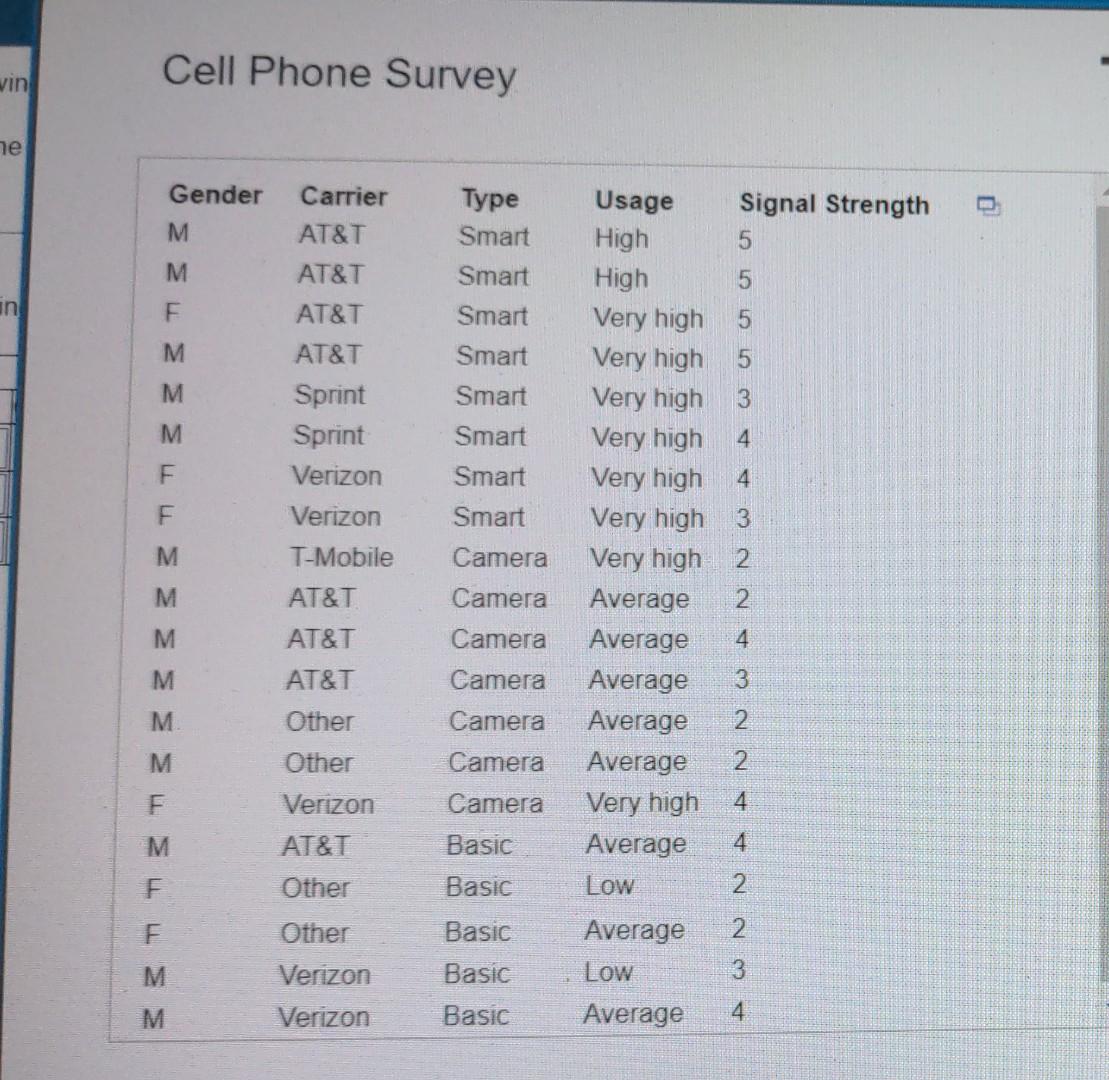
Construct Pivot Tables showing the counts of gender versus carrier and type versus usage in the accompanying cell phone survey data. What could be concluded from this analysis? [7: Click the icon to view the cell phone survey data. Construct Pivot Tables showing the counts of gender versus carrier in the cell phone survey data. (Type whole numbers.) What could be concluded from this analysis? A. Sprint is the most preferred. B. Verizon is the most preferred. C. AT\&T is the most preferred. D. T-Mobile is the most preferred Construct Pivot Tables showing the counts of type versus usage in the cell phone survey data (Type whole numbers) Ask my instructor Construct Pivot Tables showing the counts of gender versus carrier and type versus usage in the accompanying cell phone survey data. What could be concluded from this analysis? Click the icon to view the cell phone survey data. A. Sprint is the most preferred. B. Verizon is the most preferred. C. AT\&T is the most preferred. D. T-Mobile is the most preferred. Construct Pivot Tables showing the counts of type versus usage in the cell phone survey data. (Type whole numbers.) What could be concluded from this analysis? A. Camera phone users tend to use their phones very heavily. B. Smart phone users tend to use their phones very heavily. c. Smart phone, basic phone, and camera phone users tend to use their phones equally. D. Basic phone users tend to use their phones very heavily. Construct Pivot Tables showing the counts of gender versus carrier and type versus usage in the accompanying cell phone survey data. What could be concluded from this analysis? Click the icon to view the cell phone survey data. Construct Pivot Tables showing the counts of gender versus carrier in the cell phone survey data. (Type whole numbers.) Cell Phone SurveyStep by Step Solution
There are 3 Steps involved in it
Step: 1

Get Instant Access to Expert-Tailored Solutions
See step-by-step solutions with expert insights and AI powered tools for academic success
Step: 2

Step: 3
Ace Your Homework with AI
Get the answers you need in no time with our AI-driven, step-by-step assistance
Get Started
Offer To Purchase Real Estate Form Book Make An Offer To Purchase Real Estate Properties
Authors: Joe F. Barajas
1st Edition
979-8440894389