

Answered step by step
Verified Expert Solution
Question
1 Approved Answer
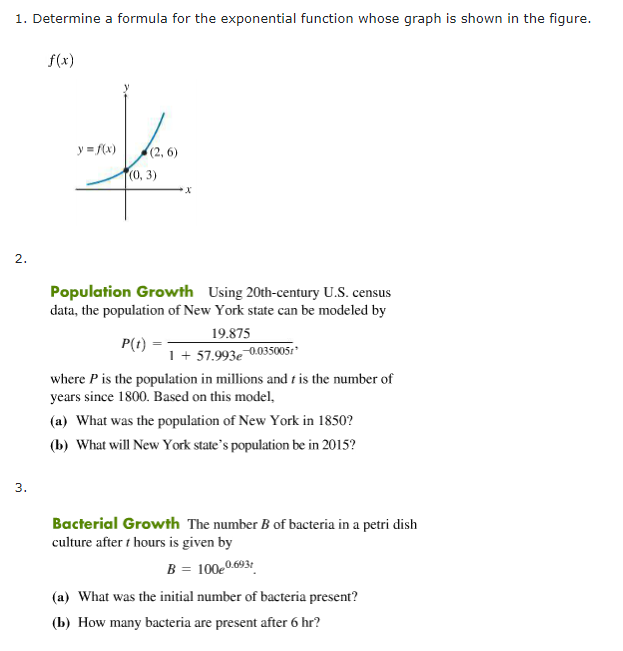
(Show work) 1. Determine a formula for the exponential function whose graph is shown in the figure. f(x) Y=/(x) (2, 6) 1(0, 3) . X
(Show work)
Step by Step Solution
There are 3 Steps involved in it
Step: 1

Get Instant Access to Expert-Tailored Solutions
See step-by-step solutions with expert insights and AI powered tools for academic success
Step: 2

Step: 3
Ace Your Homework with AI
Get the answers you need in no time with our AI-driven, step-by-step assistance
Get Started