

Answered step by step
Verified Expert Solution
Question
1 Approved Answer
Show work please Calculate the 10 & 20 day moving average for each of the assets. Graph the two moving averages for each in the
Show work please
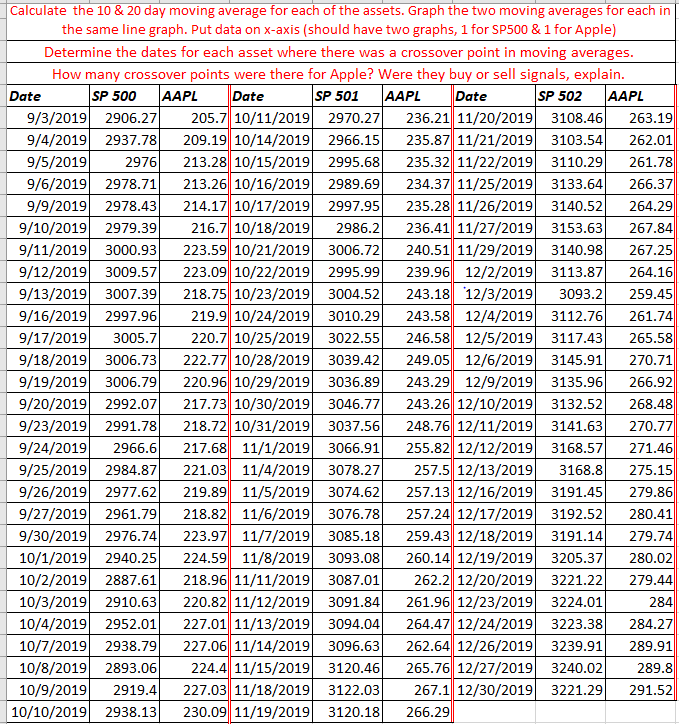
Calculate the 10 & 20 day moving average for each of the assets. Graph the two moving averages for each in the same line graph. Put data on x-axis (should have two graphs, 1 for SP500 & 1 for Apple) Determine the dates for each asset where there was a crossover point in moving averages How many crossover points were there for Apple? Were they buy or sell signals, explain. Date SP 500 AAPL Date SP 501 AAPL Date SP 502 AAPL 1 9/3/2019 2906.271 205.7|10/11/2019 2970.27 236.21/11/20/20190 3108.46 263.19|| 9/4/2019 2937.78 209.19|10/14/2019 2966.15 235.87|11/21/2019 3103.54 262.01 1 9/5/2019 2976 213.28| 10/15/2019 2995.68 235.32 11/22/2019 3110.29 261.78|| 19/6/2019 2978.71 213.26 10/16/2019 2989.69 234.37|11/25/2019 3133.64 266.37|| 9/9/2019 2978.43 214.17||10/17/2019 2997.95 235.28| 11/26/2019 3140.52 264.29|| 9/10/2019 2979.39 216.7 10/18/2019 2986.2 236.41 11/27/2019 3153.63 267.84 9/11/2019 3000.93 223.59 10/21/2019 3006.72 240.51 11/29/2019 3140.98 267.25 9/12/2019 3009.57 223.09 10/22/2019 2995.99 239.96 12/2/2019 3113.87 264.16 9/13/2019 3007.39 218.75 10/23/2019 3004.52 243.18 12/3/2019 3093.2 259.45 9/16/2019 2997.96 219.9 10/24/2019 3010.29 243.58 12/4/2019 3112.76 261.74 9/17/2019 3005.7 220.7 10/25/2019 3022.55 246.58 12/5/2019 3117.43 265.58 9/18/2019 3006.73 222.77 10/28/2019 3039.42 249.05 12/6/2019 3145.91 270.71 9/19/2019 3006.79 220.96 10/29/2019 3036.89 243.29 12/9/2019 3135.96 266.92 9/20/2019 2992.07 217.73 10/30/2019 3046.77 243.26 12/10/2019 3132.52 268.48 9/23/2019 2991.78 218.7210/31/2019 3037.56 248.76|| 12/11/2019 3141.63 270.77 9/24/2019 2966.6 217.68 11/1/2019 3066.91 255.82 12/12/2019 3168.57 271.46 9/25/2019 2984.87 221.03|| 11/4/2019 3078.27 257.5 12/13/2019 3168.8 275.15|| 9/26/2019 2977.62 219.89 11/5/2019 3074.62 257.13 12/16/2019 3191.45 279.86 9/27/2019 2961.79 218.82 11/6/2019 3076.78 257.24 12/17/2019 3192.52 280.41 9/30/2019 2976.74 223.97| 11/7/2019 3085.18 259.43|| 12/18/2019 3191.14 279.74 10/1/2019 2940.25. 224.59 11/8/2019 3093.08. 260.14/12/19/20191 3205.37| 280.02 10/2/2019 2887.61 218.96 11/11/2019 3087.01 262.2 12/20/2019 3221.22 279.44 10/3/2019 2910.63 220.82 11/12/2019 3091.84 261.96 12/23/2019 3224.01 284 10/4/2019 2952.01 227.01 11/13/2019 3094.04 264.47 12/24/2019 3223.38 284.27 10/7/2019 2938.79 227.06 11/14/2019 3096.63 262.64 12/26/2019 3239.91 289.91 10/8/2019 2893.06 224.4 11/15/2019 3120.46 265.76 12/27/2019 3240.02 289.8 10/9/2019 2919.4. 227.03|11/18/2019 3122.03 267.1 12/30/2019 3221.29 291.52|| 10/10/2019 2938.13] 230.09 11/19/2019 3120.18 266.29 Calculate the 10 & 20 day moving average for each of the assets. Graph the two moving averages for each in the same line graph. Put data on x-axis (should have two graphs, 1 for SP500 & 1 for Apple) Determine the dates for each asset where there was a crossover point in moving averages How many crossover points were there for Apple? Were they buy or sell signals, explain. Date SP 500 AAPL Date SP 501 AAPL Date SP 502 AAPL 1 9/3/2019 2906.271 205.7|10/11/2019 2970.27 236.21/11/20/20190 3108.46 263.19|| 9/4/2019 2937.78 209.19|10/14/2019 2966.15 235.87|11/21/2019 3103.54 262.01 1 9/5/2019 2976 213.28| 10/15/2019 2995.68 235.32 11/22/2019 3110.29 261.78|| 19/6/2019 2978.71 213.26 10/16/2019 2989.69 234.37|11/25/2019 3133.64 266.37|| 9/9/2019 2978.43 214.17||10/17/2019 2997.95 235.28| 11/26/2019 3140.52 264.29|| 9/10/2019 2979.39 216.7 10/18/2019 2986.2 236.41 11/27/2019 3153.63 267.84 9/11/2019 3000.93 223.59 10/21/2019 3006.72 240.51 11/29/2019 3140.98 267.25 9/12/2019 3009.57 223.09 10/22/2019 2995.99 239.96 12/2/2019 3113.87 264.16 9/13/2019 3007.39 218.75 10/23/2019 3004.52 243.18 12/3/2019 3093.2 259.45 9/16/2019 2997.96 219.9 10/24/2019 3010.29 243.58 12/4/2019 3112.76 261.74 9/17/2019 3005.7 220.7 10/25/2019 3022.55 246.58 12/5/2019 3117.43 265.58 9/18/2019 3006.73 222.77 10/28/2019 3039.42 249.05 12/6/2019 3145.91 270.71 9/19/2019 3006.79 220.96 10/29/2019 3036.89 243.29 12/9/2019 3135.96 266.92 9/20/2019 2992.07 217.73 10/30/2019 3046.77 243.26 12/10/2019 3132.52 268.48 9/23/2019 2991.78 218.7210/31/2019 3037.56 248.76|| 12/11/2019 3141.63 270.77 9/24/2019 2966.6 217.68 11/1/2019 3066.91 255.82 12/12/2019 3168.57 271.46 9/25/2019 2984.87 221.03|| 11/4/2019 3078.27 257.5 12/13/2019 3168.8 275.15|| 9/26/2019 2977.62 219.89 11/5/2019 3074.62 257.13 12/16/2019 3191.45 279.86 9/27/2019 2961.79 218.82 11/6/2019 3076.78 257.24 12/17/2019 3192.52 280.41 9/30/2019 2976.74 223.97| 11/7/2019 3085.18 259.43|| 12/18/2019 3191.14 279.74 10/1/2019 2940.25. 224.59 11/8/2019 3093.08. 260.14/12/19/20191 3205.37| 280.02 10/2/2019 2887.61 218.96 11/11/2019 3087.01 262.2 12/20/2019 3221.22 279.44 10/3/2019 2910.63 220.82 11/12/2019 3091.84 261.96 12/23/2019 3224.01 284 10/4/2019 2952.01 227.01 11/13/2019 3094.04 264.47 12/24/2019 3223.38 284.27 10/7/2019 2938.79 227.06 11/14/2019 3096.63 262.64 12/26/2019 3239.91 289.91 10/8/2019 2893.06 224.4 11/15/2019 3120.46 265.76 12/27/2019 3240.02 289.8 10/9/2019 2919.4. 227.03|11/18/2019 3122.03 267.1 12/30/2019 3221.29 291.52|| 10/10/2019 2938.13] 230.09 11/19/2019 3120.18 266.29Step by Step Solution
There are 3 Steps involved in it
Step: 1

Get Instant Access to Expert-Tailored Solutions
See step-by-step solutions with expert insights and AI powered tools for academic success
Step: 2

Step: 3
Ace Your Homework with AI
Get the answers you need in no time with our AI-driven, step-by-step assistance
Get Started
Challenging Global Finance
Authors: Elizabeth Friesen
2012th Edition
0230348793, 978-0230348790