

Answered step by step
Verified Expert Solution
Question
1 Approved Answer
SHOW WORKINGS for ALL your answers: An investor, Mr WEALTHY has two assets available named X and Y. Asset X has an expected return of
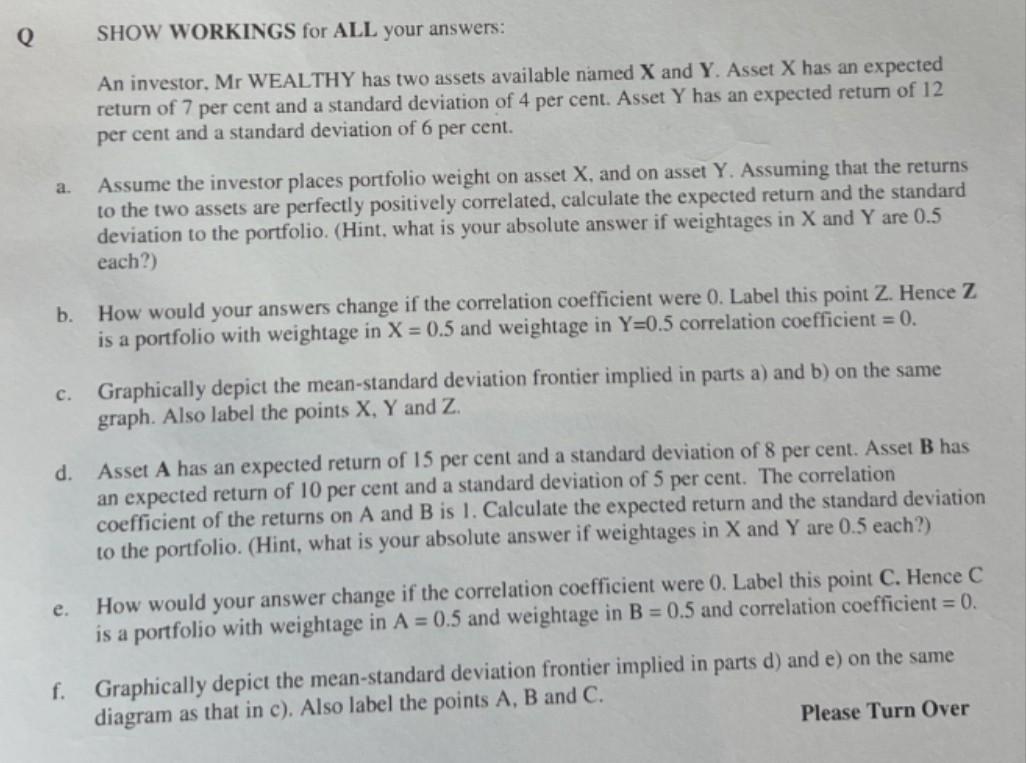
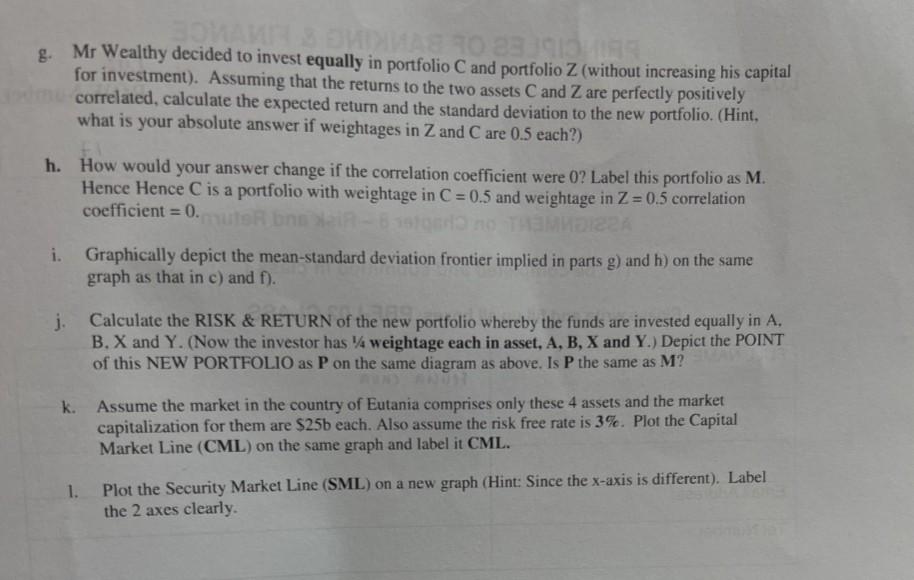
SHOW WORKINGS for ALL your answers: An investor, Mr WEALTHY has two assets available named X and Y. Asset X has an expected return of 7 per cent and a standard deviation of 4 per cent. Asset Y has an expected return of 12 per cent and a standard deviation of 6 per cent. a. Assume the investor places portfolio weight on asset X, and on asset Y. Assuming that the returns to the two assets are perfectly positively correlated, calculate the expected return and the standard deviation to the portfolio. (Hint, what is your absolute answer if weightages in X and Y are 0.5 each?) b. How would your answers change if the correlation coefficient were 0 . Label this point Z. Hence Z is a portfolio with weightage in X=0.5 and weightage in Y=0.5 correlation coefficient =0. c. Graphically depict the mean-standard deviation frontier implied in parts a) and b) on the same graph. Also label the points X,Y and Z. d. Asset A has an expected return of 15 per cent and a standard deviation of 8 per cent. Asset B has an expected return of 10 per cent and a standard deviation of 5 per cent. The correlation coefficient of the returns on A and B is 1 . Calculate the expected return and the standard deviation to the portfolio. (Hint, what is your absolute answer if weightages in X and Y are 0.5 each?) e. How would your answer change if the correlation coefficient were 0 . Label this point C. Hence C is a portfolio with weightage in A=0.5 and weightage in B=0.5 and correlation coefficient =0. f. Graphically depict the mean-standard deviation frontier implied in parts d) and e) on the same diagram as that in c). Also label the points A,B and C. Please Turn Over g. Mr Wealthy decided to invest equally in portfolio C and portfolio Z (without increasing his capital for investment). Assuming that the returns to the two assets C and Z are perfectly positively correlated, calculate the expected return and the standard deviation to the new portfolio. (Hint, what is your absolute answer if weightages in Z and C are 0.5 each?) h. How would your answer change if the correlation coefficient were 0? Label this portfolio as M. Hence Hence C is a portfolio with weightage in C=0.5 and weightage in Z=0.5 correlation coefficient =0 i. Graphically depict the mean-standard deviation frontier implied in parts g ) and h) on the same graph as that in c) and f. j. Calculate the RISK \& RETURN of the new portfolio whereby the funds are invested equally in A, B. X and Y. (Now the investor has 1/4 weightage each in asset, A,B,X and Y.) Depict the POINT of this NEW PORTFOLIO as P on the same diagram as above, Is P the same as M ? k. Assume the market in the country of Eutania comprises only these 4 assets and the market capitalization for them are $25 b each. Also assume the risk free rate is 3%. Plot the Capital Market Line (CML) on the same graph and label it CML. 1. Plot the Security Market Line (SML) on a new graph (Hint: Since the x-axis is different). Label the 2 axes clearly. SHOW WORKINGS for ALL your answers: An investor, Mr WEALTHY has two assets available named X and Y. Asset X has an expected return of 7 per cent and a standard deviation of 4 per cent. Asset Y has an expected return of 12 per cent and a standard deviation of 6 per cent. a. Assume the investor places portfolio weight on asset X, and on asset Y. Assuming that the returns to the two assets are perfectly positively correlated, calculate the expected return and the standard deviation to the portfolio. (Hint, what is your absolute answer if weightages in X and Y are 0.5 each?) b. How would your answers change if the correlation coefficient were 0 . Label this point Z. Hence Z is a portfolio with weightage in X=0.5 and weightage in Y=0.5 correlation coefficient =0. c. Graphically depict the mean-standard deviation frontier implied in parts a) and b) on the same graph. Also label the points X,Y and Z. d. Asset A has an expected return of 15 per cent and a standard deviation of 8 per cent. Asset B has an expected return of 10 per cent and a standard deviation of 5 per cent. The correlation coefficient of the returns on A and B is 1 . Calculate the expected return and the standard deviation to the portfolio. (Hint, what is your absolute answer if weightages in X and Y are 0.5 each?) e. How would your answer change if the correlation coefficient were 0 . Label this point C. Hence C is a portfolio with weightage in A=0.5 and weightage in B=0.5 and correlation coefficient =0. f. Graphically depict the mean-standard deviation frontier implied in parts d) and e) on the same diagram as that in c). Also label the points A,B and C. Please Turn Over g. Mr Wealthy decided to invest equally in portfolio C and portfolio Z (without increasing his capital for investment). Assuming that the returns to the two assets C and Z are perfectly positively correlated, calculate the expected return and the standard deviation to the new portfolio. (Hint, what is your absolute answer if weightages in Z and C are 0.5 each?) h. How would your answer change if the correlation coefficient were 0? Label this portfolio as M. Hence Hence C is a portfolio with weightage in C=0.5 and weightage in Z=0.5 correlation coefficient =0 i. Graphically depict the mean-standard deviation frontier implied in parts g ) and h) on the same graph as that in c) and f. j. Calculate the RISK \& RETURN of the new portfolio whereby the funds are invested equally in A, B. X and Y. (Now the investor has 1/4 weightage each in asset, A,B,X and Y.) Depict the POINT of this NEW PORTFOLIO as P on the same diagram as above, Is P the same as M ? k. Assume the market in the country of Eutania comprises only these 4 assets and the market capitalization for them are $25 b each. Also assume the risk free rate is 3%. Plot the Capital Market Line (CML) on the same graph and label it CML. 1. Plot the Security Market Line (SML) on a new graph (Hint: Since the x-axis is different). Label the 2 axes clearly
Step by Step Solution
There are 3 Steps involved in it
Step: 1

Get Instant Access to Expert-Tailored Solutions
See step-by-step solutions with expert insights and AI powered tools for academic success
Step: 2

Step: 3
Ace Your Homework with AI
Get the answers you need in no time with our AI-driven, step-by-step assistance
Get Started
The Critical Handbook Of Money Laundering Policy Analysis And Myths
Authors: Petrus C. Van Duyne, Jackie H. Harvey, Liliya Y. Gelemerova
1st Edition
1137523972, 978-1137523976