Question
Show your steps and calculations for the tables for a-c. Historical Utilization Trends Historical inpatient utilization trends may be helpful in understanding the potential for
Show your steps and calculations for the tables for a-c.
Historical Utilization Trends
Historical inpatient utilization trends may be helpful in understanding the potential for increases in market share and profitability of future planning. Table 13.4 presents descriptive statistics on length of stay in the three hospitals in the Westside Hospital Network. The mean length of stay for the overall hospital network is 5.09 days (standard deviation of 6.17 days). Male patients have a longer length of stay than females do, and white patients have a shorter length of stay than patients of all other races do. Westside Medical Center has shorter stays, with private insurance patients demonstrating the shortest length of stay (mean of 4.92 days).
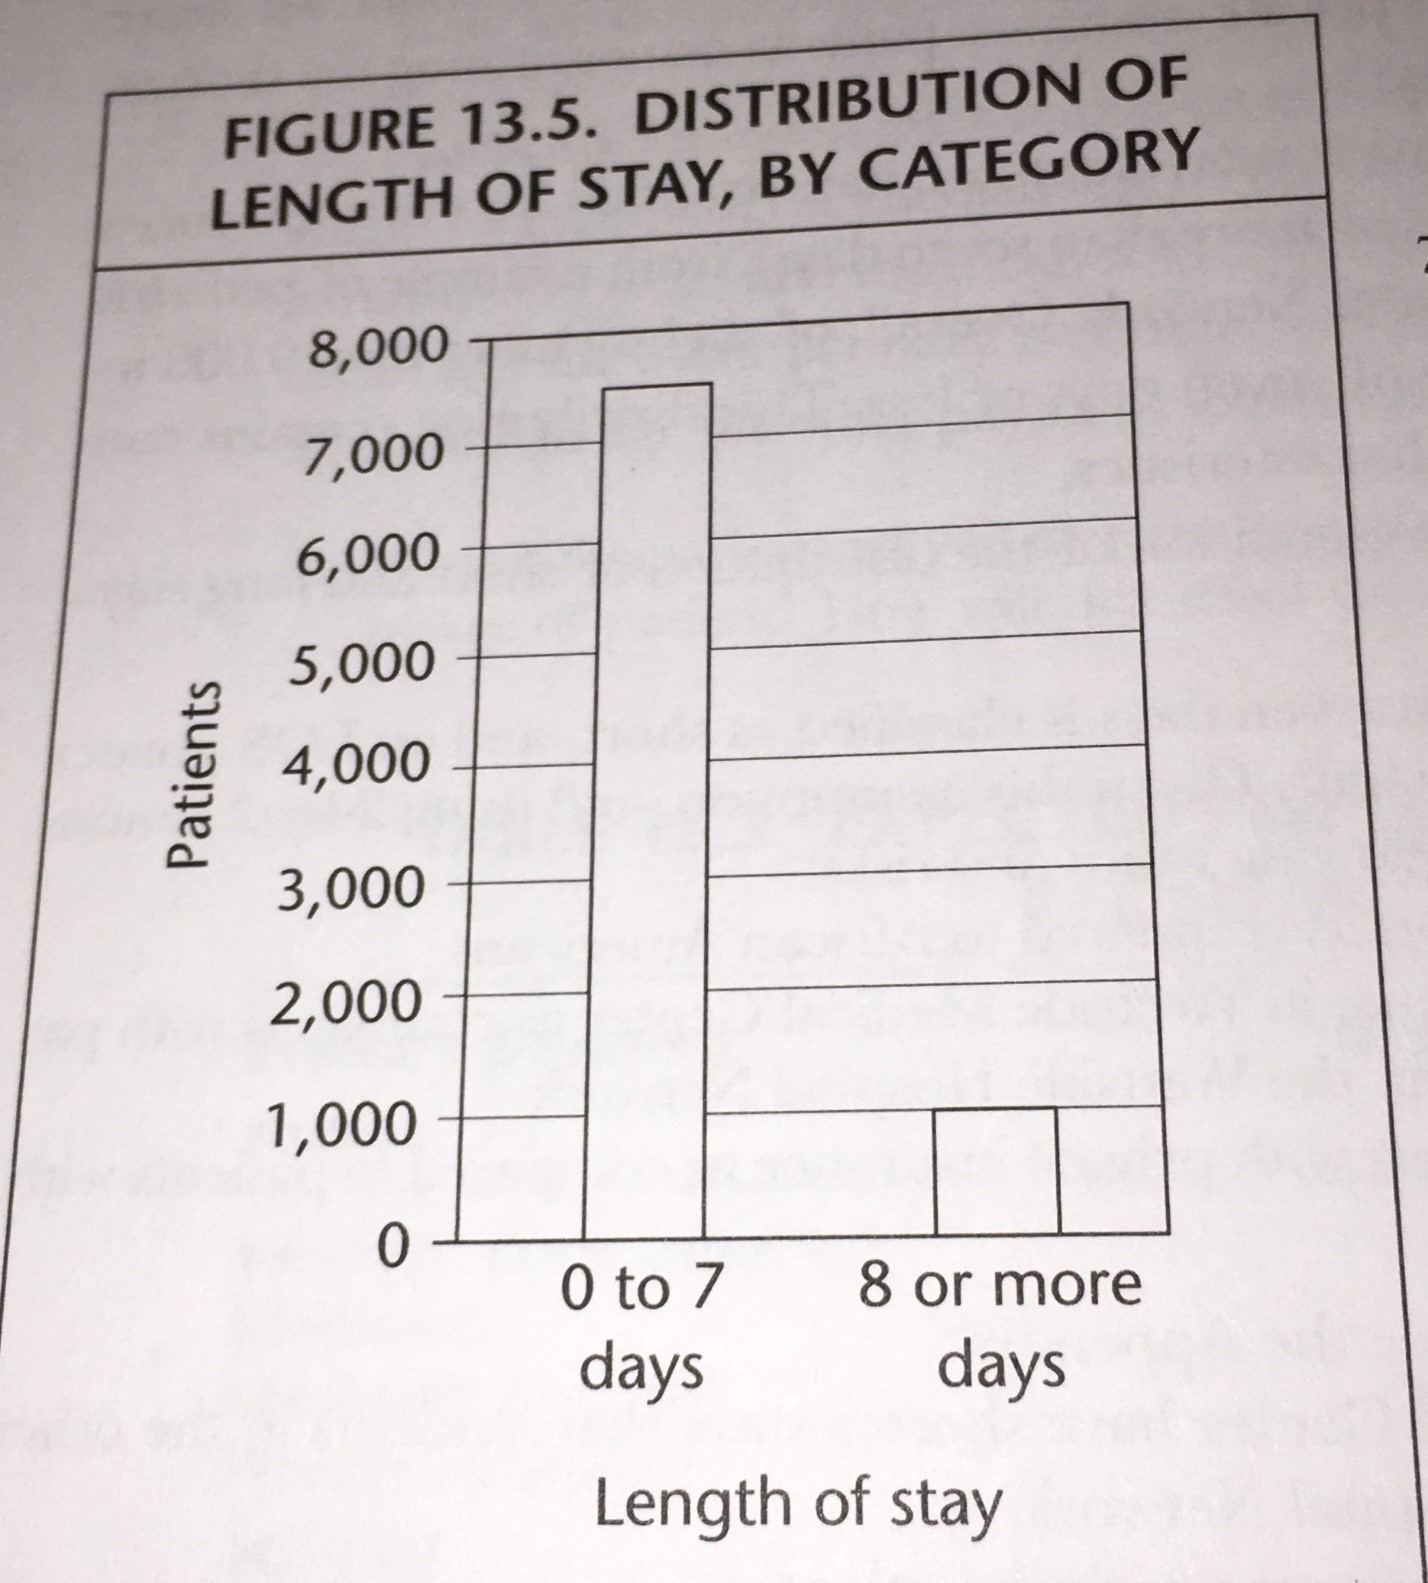
Table 13.5 presents information on length of stay, stratified into two categories (stay up to seven days and stays of more than seven days), from a sample of pediatric inpatients in the Westside Hospital Network. Overall, of slightly more than 9,000 inpatient says, 7,854 (87%) were of seven days or less. This distribution remains constant regardless of population characteristics.
Figure 13.5 is a graphic representation of the distribution of short and long stays.
Assume that a LOS (length of stay) of up to seven days is classified as short, and an LOS greater than seven days is classified as long. Given this assumption, and using 2-by-2 contingency tables, determine the following ratios and risks.
a.Risk of a long stay for whites as compared to African Americans
b.Risk of a long stay for patients in Westside Medical Center as compared with patients in the other hospitals in Westside Hospital Network.
c.Risk of a long stay for patients with private insurance as compared to patients with all other payment sources.
Table 13.4 Length of Stay, by population characteristics.
Characteristics Mean (days)Median (days)Standard
deviation
Overall 5.093.006.17
Sex
Male 6.49 4.008.77
Female 4.71 3.00 6.17
Race
White 5.433.007.78
Black 6.724.007.10
Other 5.894.006.32
Hospital
Eastside Hospital 7.235.008.51
Riverside Hospital 5.39 3.008.32
Westside Medical Center 5.313.007.14
Primary payment source
Worker's compensation 4.983.006.44
Medicare 8.476.009.49
Medicaid or CHIP 5.513.006.23
Private insurance4.923.006.57
Self-pay5.803.007.39
Other5.303.006.52
Table 13.5 Distribution of short and long stays, by population characteristics.
CharacteristicNumber of short Number of long
stays (up to 7 days)stays (more than 7 days)
Overall7,8541,185
Age
Under 5 years3,995690
6-10 years1,023135
11-14 years780138
15-18 years2,056222
Sex
Male 3,774649
Female4,080536
Race
White4,103572
Black1,651283
Other20042
Hospital
Eastside Hospital98174
Riverside Hospital1,401211
Westside Medical Center5,472900
Primary payment source
Workers' compensation 151
Medicare 3520
Medicaid or CHIP2,209363
Private insurance4,175596
Self-pay69077
Other52690

Step by Step Solution
There are 3 Steps involved in it
Step: 1

Get Instant Access to Expert-Tailored Solutions
See step-by-step solutions with expert insights and AI powered tools for academic success
Step: 2

Step: 3

Ace Your Homework with AI
Get the answers you need in no time with our AI-driven, step-by-step assistance
Get Started


