Answered step by step
Verified Expert Solution
Link Copied!

Question

1 Approved Answer

Showing financial statement data and stock price data for Mydeco Corp. a. By what percentage did Mydeco's revenues grow each year from 2013 to 2016?

Showing financial statement data and stock price data for Mydeco Corp.

a. By what percentage did Mydeco's revenues grow each year from 2013 to 2016?

b. By what percentage did net income grow each year?

c. Why might the growth rates of revenues and net income differ?image text in transcribed

Income Statement 2012 2016 2013 2014 2015 Revenue Cost of Goods Sold Gross Profit Sales and Marketing Administration Depreciation & Amortization EBIT Interest Income (Expense) Pretax Income Income Tax Net Income Shares Outstanding (millions) Earnings per Share Balance Sheet Assets 400.7 604.1 365.4 426.4 510.2 (184.5) (175.6) (205.1) (247.6) (297.2) 262.6 216.2 189.8 221.3 306.9 (67.6) (58.8) (26.2) (64.5) (81.0) (99.1) (121.1) (59.0) (59.7) (68.0) (79.4) (34.2) (38.5) (26.8) (39.3) 63.6 39.5 46.4 57 67.1 (33.3) (31.4) (30.4) (37.0) (39.0) 30.3 8.1 16 20 28.1 (10.6) (2.8) (7.0) (9.8) (5.6) 5.3 19.7 10.4 13 18.3 56.5 56.5 56.5 56.5 56.5 $0.35 $0.09 $0.18 2014 $0.23 $0.32 2016 2012 2013 2015 Cash Accounts Receivable Inventory Total Current Assets Net Property, Plant & Equip. Goodwill & Intangibles Total Assets Liabilities &Stockholders' Equity Accounts Payable Accrued Compens ation Total Current Liabilities Long-term Debt Total Liabilities Stockholders' Equity Total Liabilities & Stockholders' Equity Statement of Cash Flows Net Income Depreciation & Amortization Chg. in Accounts Receivable Chg. in Inventory Chg. in Pay. & Accrued Comp. Cash from Operations Capital Expenditures Cash from Investing Activ. Dividends Paid Sale (or purchase) of stock Debt Issuance (Pay Down) Cash from Financing Activ. Change in Cash Mydeco Stock Price 48.6 92.7 101.1 69.7 97.6 75.1 90.2 69.4 68.1 86.7 33.4 34.6 30.7 29.5 33.5 173.4 169.8 195.2 201.2 221.3 343.4 247.1 306.1 245.1 343.6 362.2 362.2 362.2 362.2 362.2 906.8 780.7 779.1 863.5 927.1 20.1 33.1 16.1 21.9 27.5 6.6 5.6 7.1 8.5 10.1 26.7 21.7 29 36 43.2 499.3 499.3 573.5 599 599 526 521 602.5 635 642.2 254.7 258.1 261 271.8 284.9 863.5 780.7 779.1 906.8 927.1 2015 2012 2013 2014 2016 19.7 5.3 10.4 13 18.3 26.2 26.8 34.2 38.5 39.3 (7.0) 3.9 20.8 1.3 (11.6) (2.9) 3.9 1.2 (3.9) (0.1) 7.2 3.1 (5.0) 7.3 7 50 51.8 54.4 47.6 53.1 (96.0) (23.6) (26.0) (73.3) (38.2) (38.2) (23.6) (26.0) (96.0) (73.3) (4.7) (4.7) (4.7) (4.7) (6.5) 74.2 25.5 69.5 (4.7) (4.7) 20.8 (6.5) 21.1 8.4 21.7 27.9 (4.9) $3.44 $7.82 $4.65 $8.64 $11.49

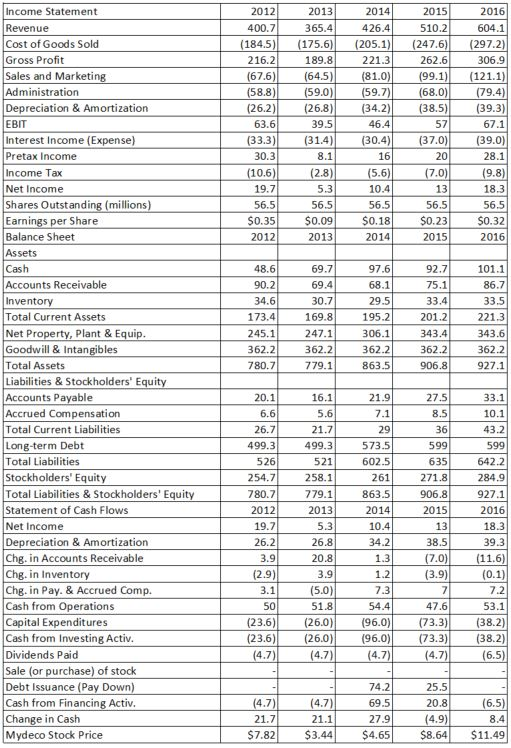
Step by Step Solution

There are 3 Steps involved in it

Step: 1

blur-text-image

Get Instant Access to Expert-Tailored Solutions

See step-by-step solutions with expert insights and AI powered tools for academic success

Step: 2

blur-text-image

Step: 3

blur-text-image

Ace Your Homework with AI

Get the answers you need in no time with our AI-driven, step-by-step assistance

Get Started

Recommended Textbook for

More Books

Students also viewed these Finance questions