

Answered step by step
Verified Expert Solution
Question
1 Approved Answer
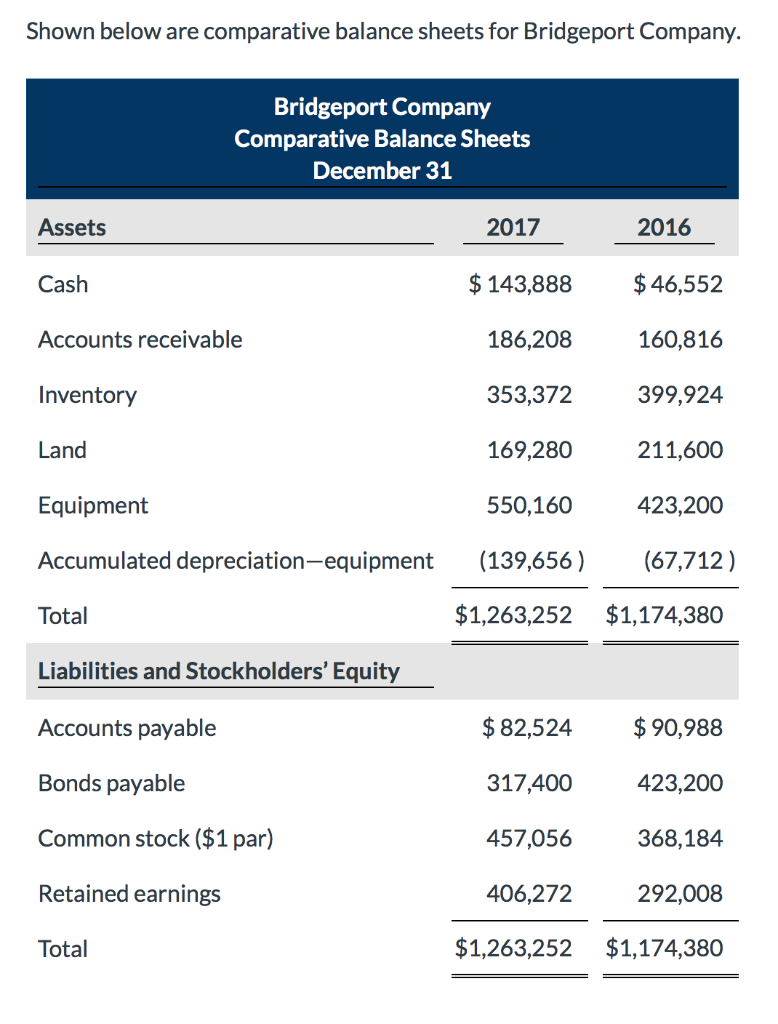
Shown below are comparative balance sheets for Bridgeport Company. Bridgeport Company Comparative Balance Sheets December 31 2017 2016 Assets Cash Accounts receivable Inventory Land Equipment
Step by Step Solution
There are 3 Steps involved in it
Step: 1

Get Instant Access to Expert-Tailored Solutions
See step-by-step solutions with expert insights and AI powered tools for academic success
Step: 2

Step: 3
Ace Your Homework with AI
Get the answers you need in no time with our AI-driven, step-by-step assistance
Get Started
How To Write A Marketing Plan Carry Out A Marketing Audit Establish Objectives And Strategies Create An Effective Plan
Authors: John Westwood
3rd Edition
0749461713, 978-0749461713