Answered step by step
Verified Expert Solution
Question
1 Approved Answer
Shown below are comparative balance sheets for Pharoah Company. Pharoah Company Comparative Balance Sheets December 31 2017 126,820 41,030 164,120 311,455 149,200 484,900 (123,090)(59,680) Assets
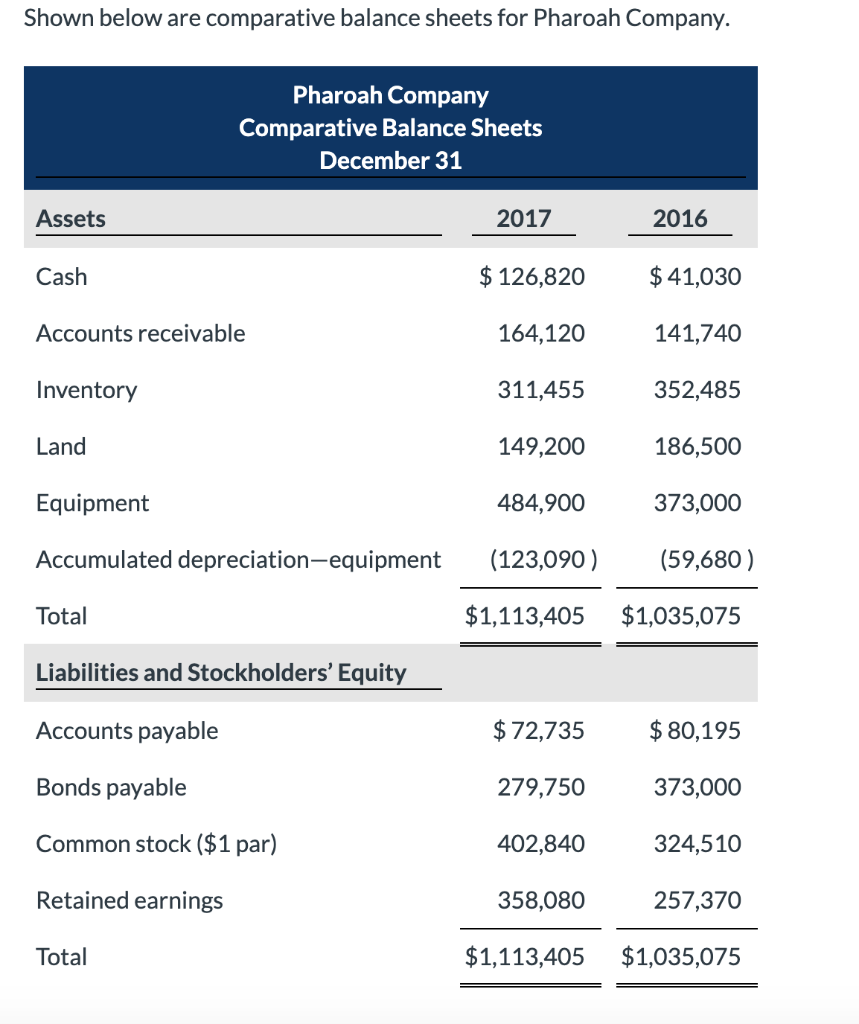
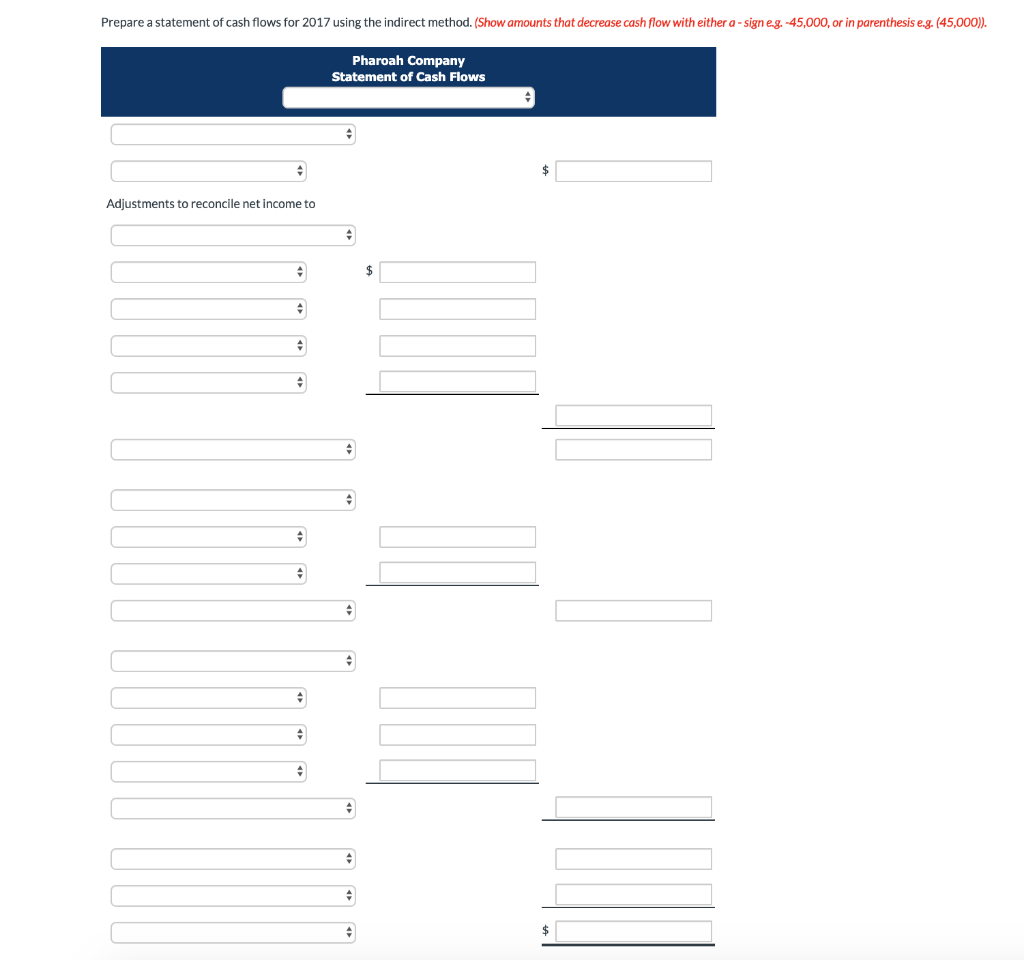
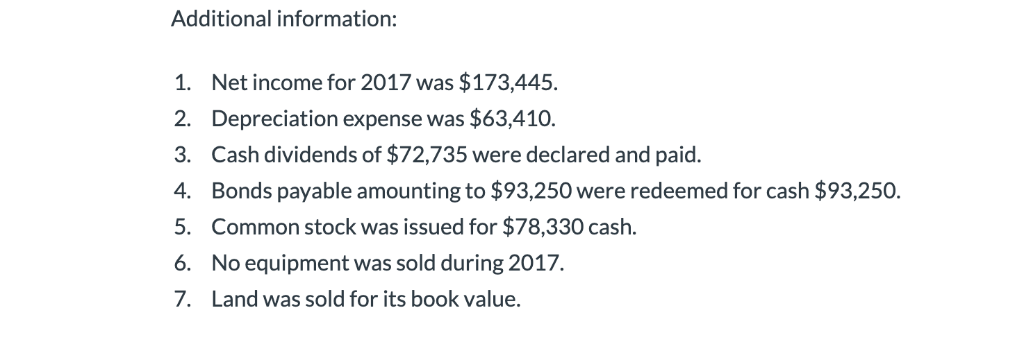
Shown below are comparative balance sheets for Pharoah Company. Pharoah Company Comparative Balance Sheets December 31 2017 126,820 41,030 164,120 311,455 149,200 484,900 (123,090)(59,680) Assets Cash Accounts receivable Inventory Land Equipment Accumulated depreciation-equipment Total Liabilities and Stockholders' Equity Accounts payable Bonds payable Common stock ($1 par) Retained earnings Total 2016 141,740 352,485 186,500 373,000 $1,113,405 $1,035,075 $72,73580,195 373,000 324,510 257,370 $1,113,405 $1,035,075 279,750 402,840 358,080 Additional information: 1. Net income for 2017 was $173,445 2. Depreciation expense was $63,410 3. Cash dividends of $72,735 were declared and paid. 4. Bonds payable amounting to $93,250 were redeemed for cash $93,250. 5. Common stock was issued for $78,330 cash. 6. No equipment was sold during 2017. 7. Land was sold for its book value. Prepare a statement of cash flows for 2017 using the indirect method. (Show amounts that decrease cash flow with either a -signeg.-45,000, or in parenthesis e.g. (45,000)). Pharoah Company Statement of Cash Flows Adjustments to reconcile net income to
Step by Step Solution
There are 3 Steps involved in it
Step: 1
Get Instant Access to Expert-Tailored Solutions
See step-by-step solutions with expert insights and AI powered tools for academic success
Step: 2
Step: 3
Ace Your Homework with AI
Get the answers you need in no time with our AI-driven, step-by-step assistance
Get Started