

Answered step by step
Verified Expert Solution
Question
1 Approved Answer
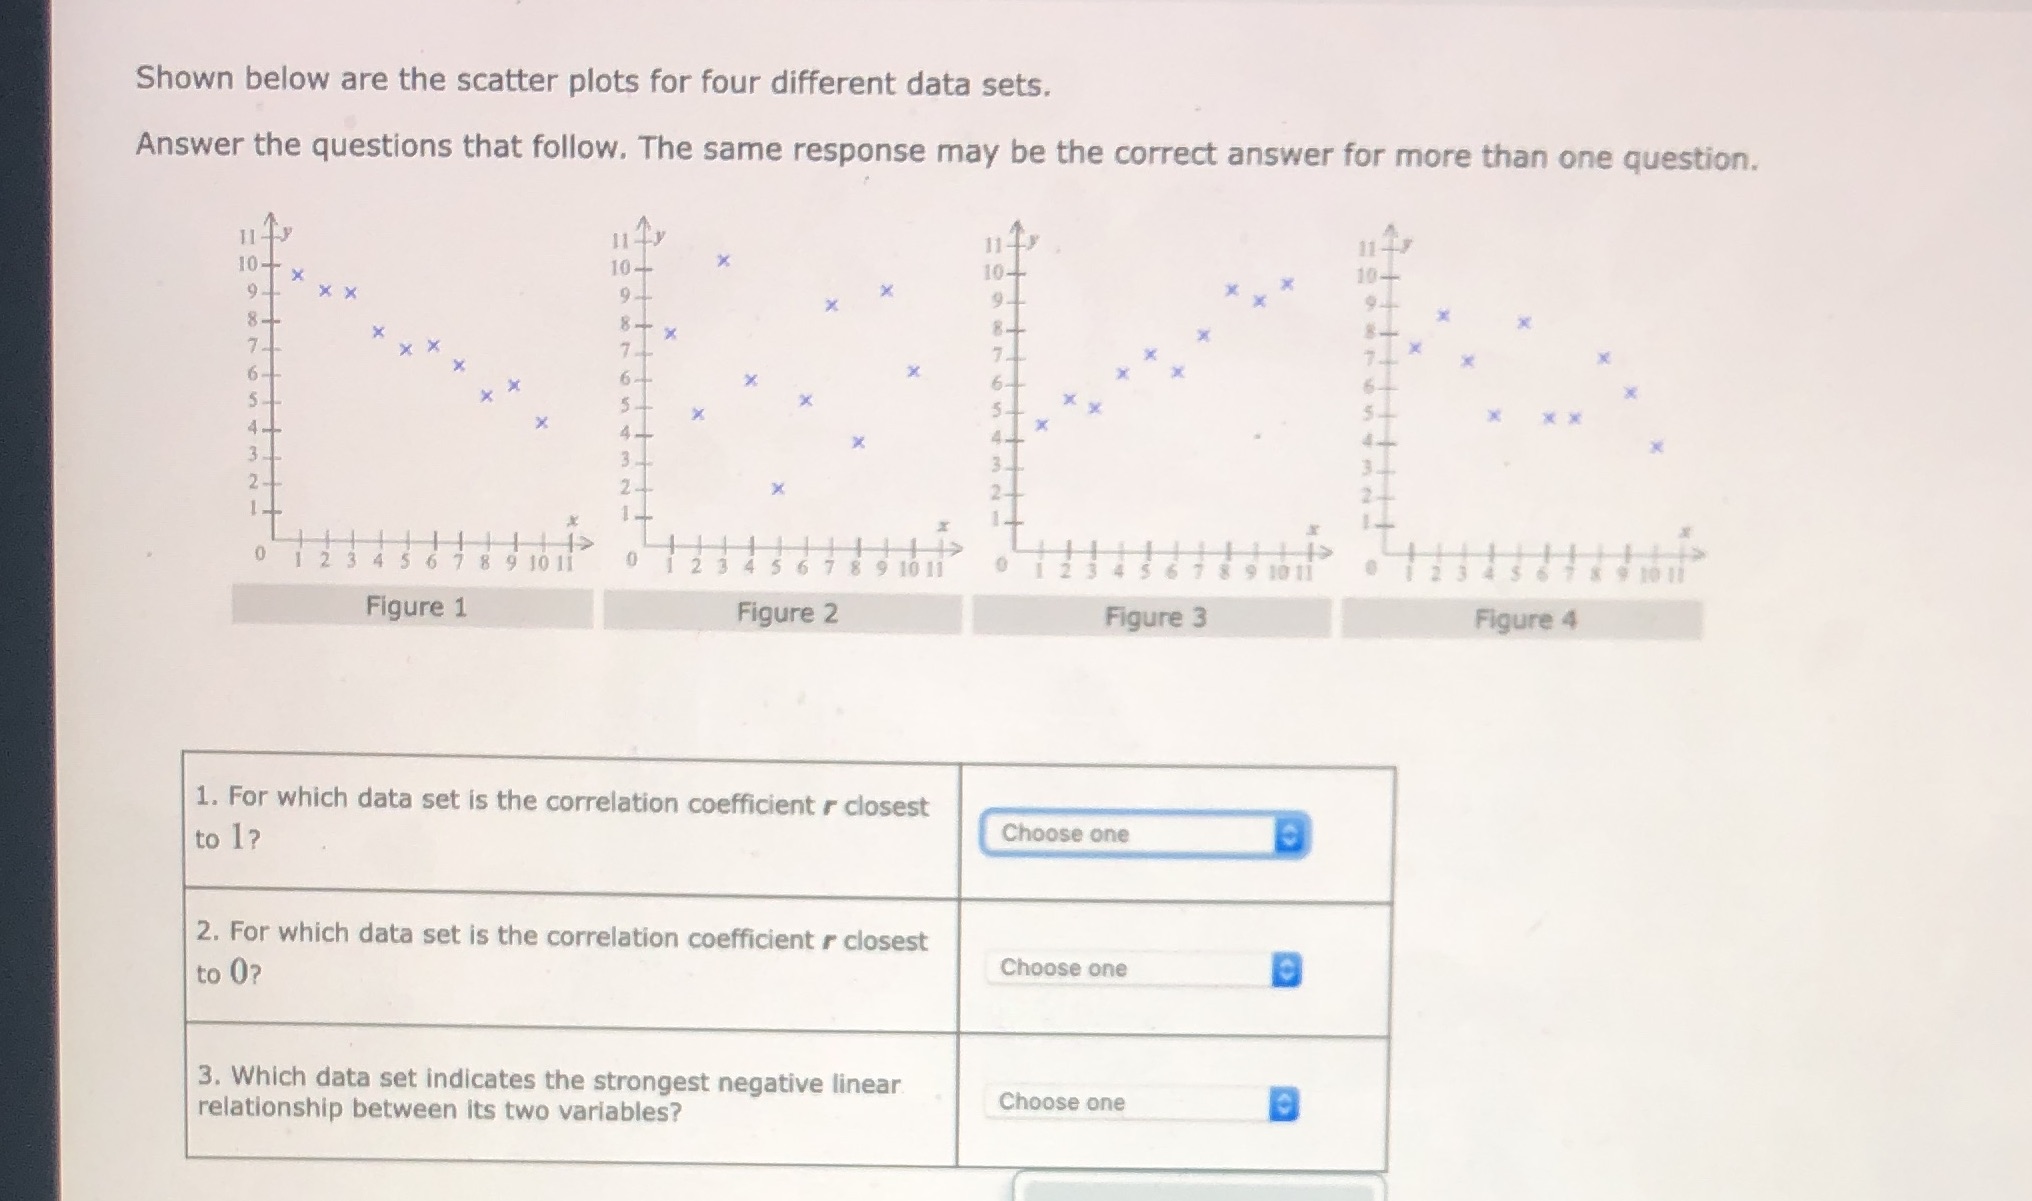
Shown below are the scatter plots for four different data sets. Answer the questions that follow. The same response may be the correct answer for
Step by Step Solution
There are 3 Steps involved in it
Step: 1

Get Instant Access to Expert-Tailored Solutions
See step-by-step solutions with expert insights and AI powered tools for academic success
Step: 2

Step: 3
Ace Your Homework with AI
Get the answers you need in no time with our AI-driven, step-by-step assistance
Get Started
Advanced Calculus
Authors: R Creighton Buck
3rd Edition
147861613X, 9781478616139