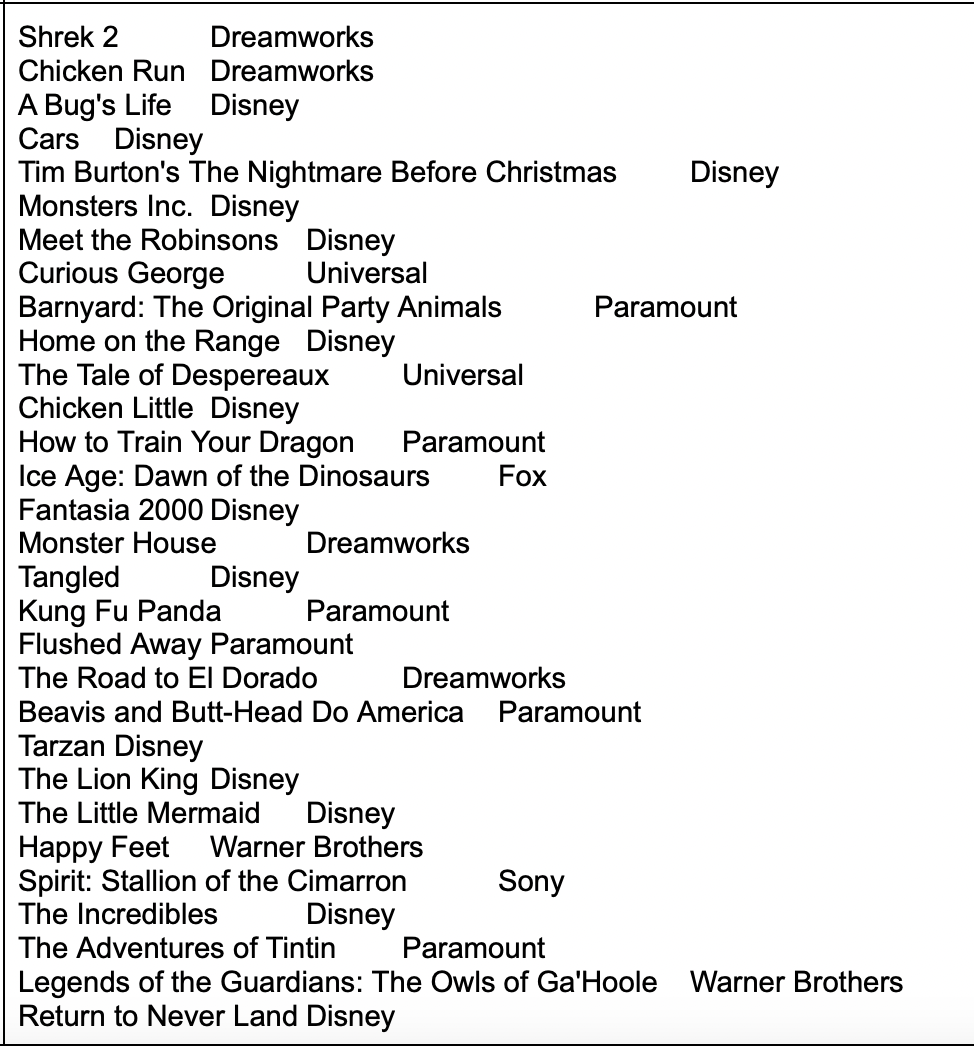
Shrek 2 Dreamworks Chicken Run Dreamworks A Bug's Life Disney Cars Disney Tim Burton's The Nightmare Before Christmas Disney Monsters Inc. Disney Meet the Robinsons
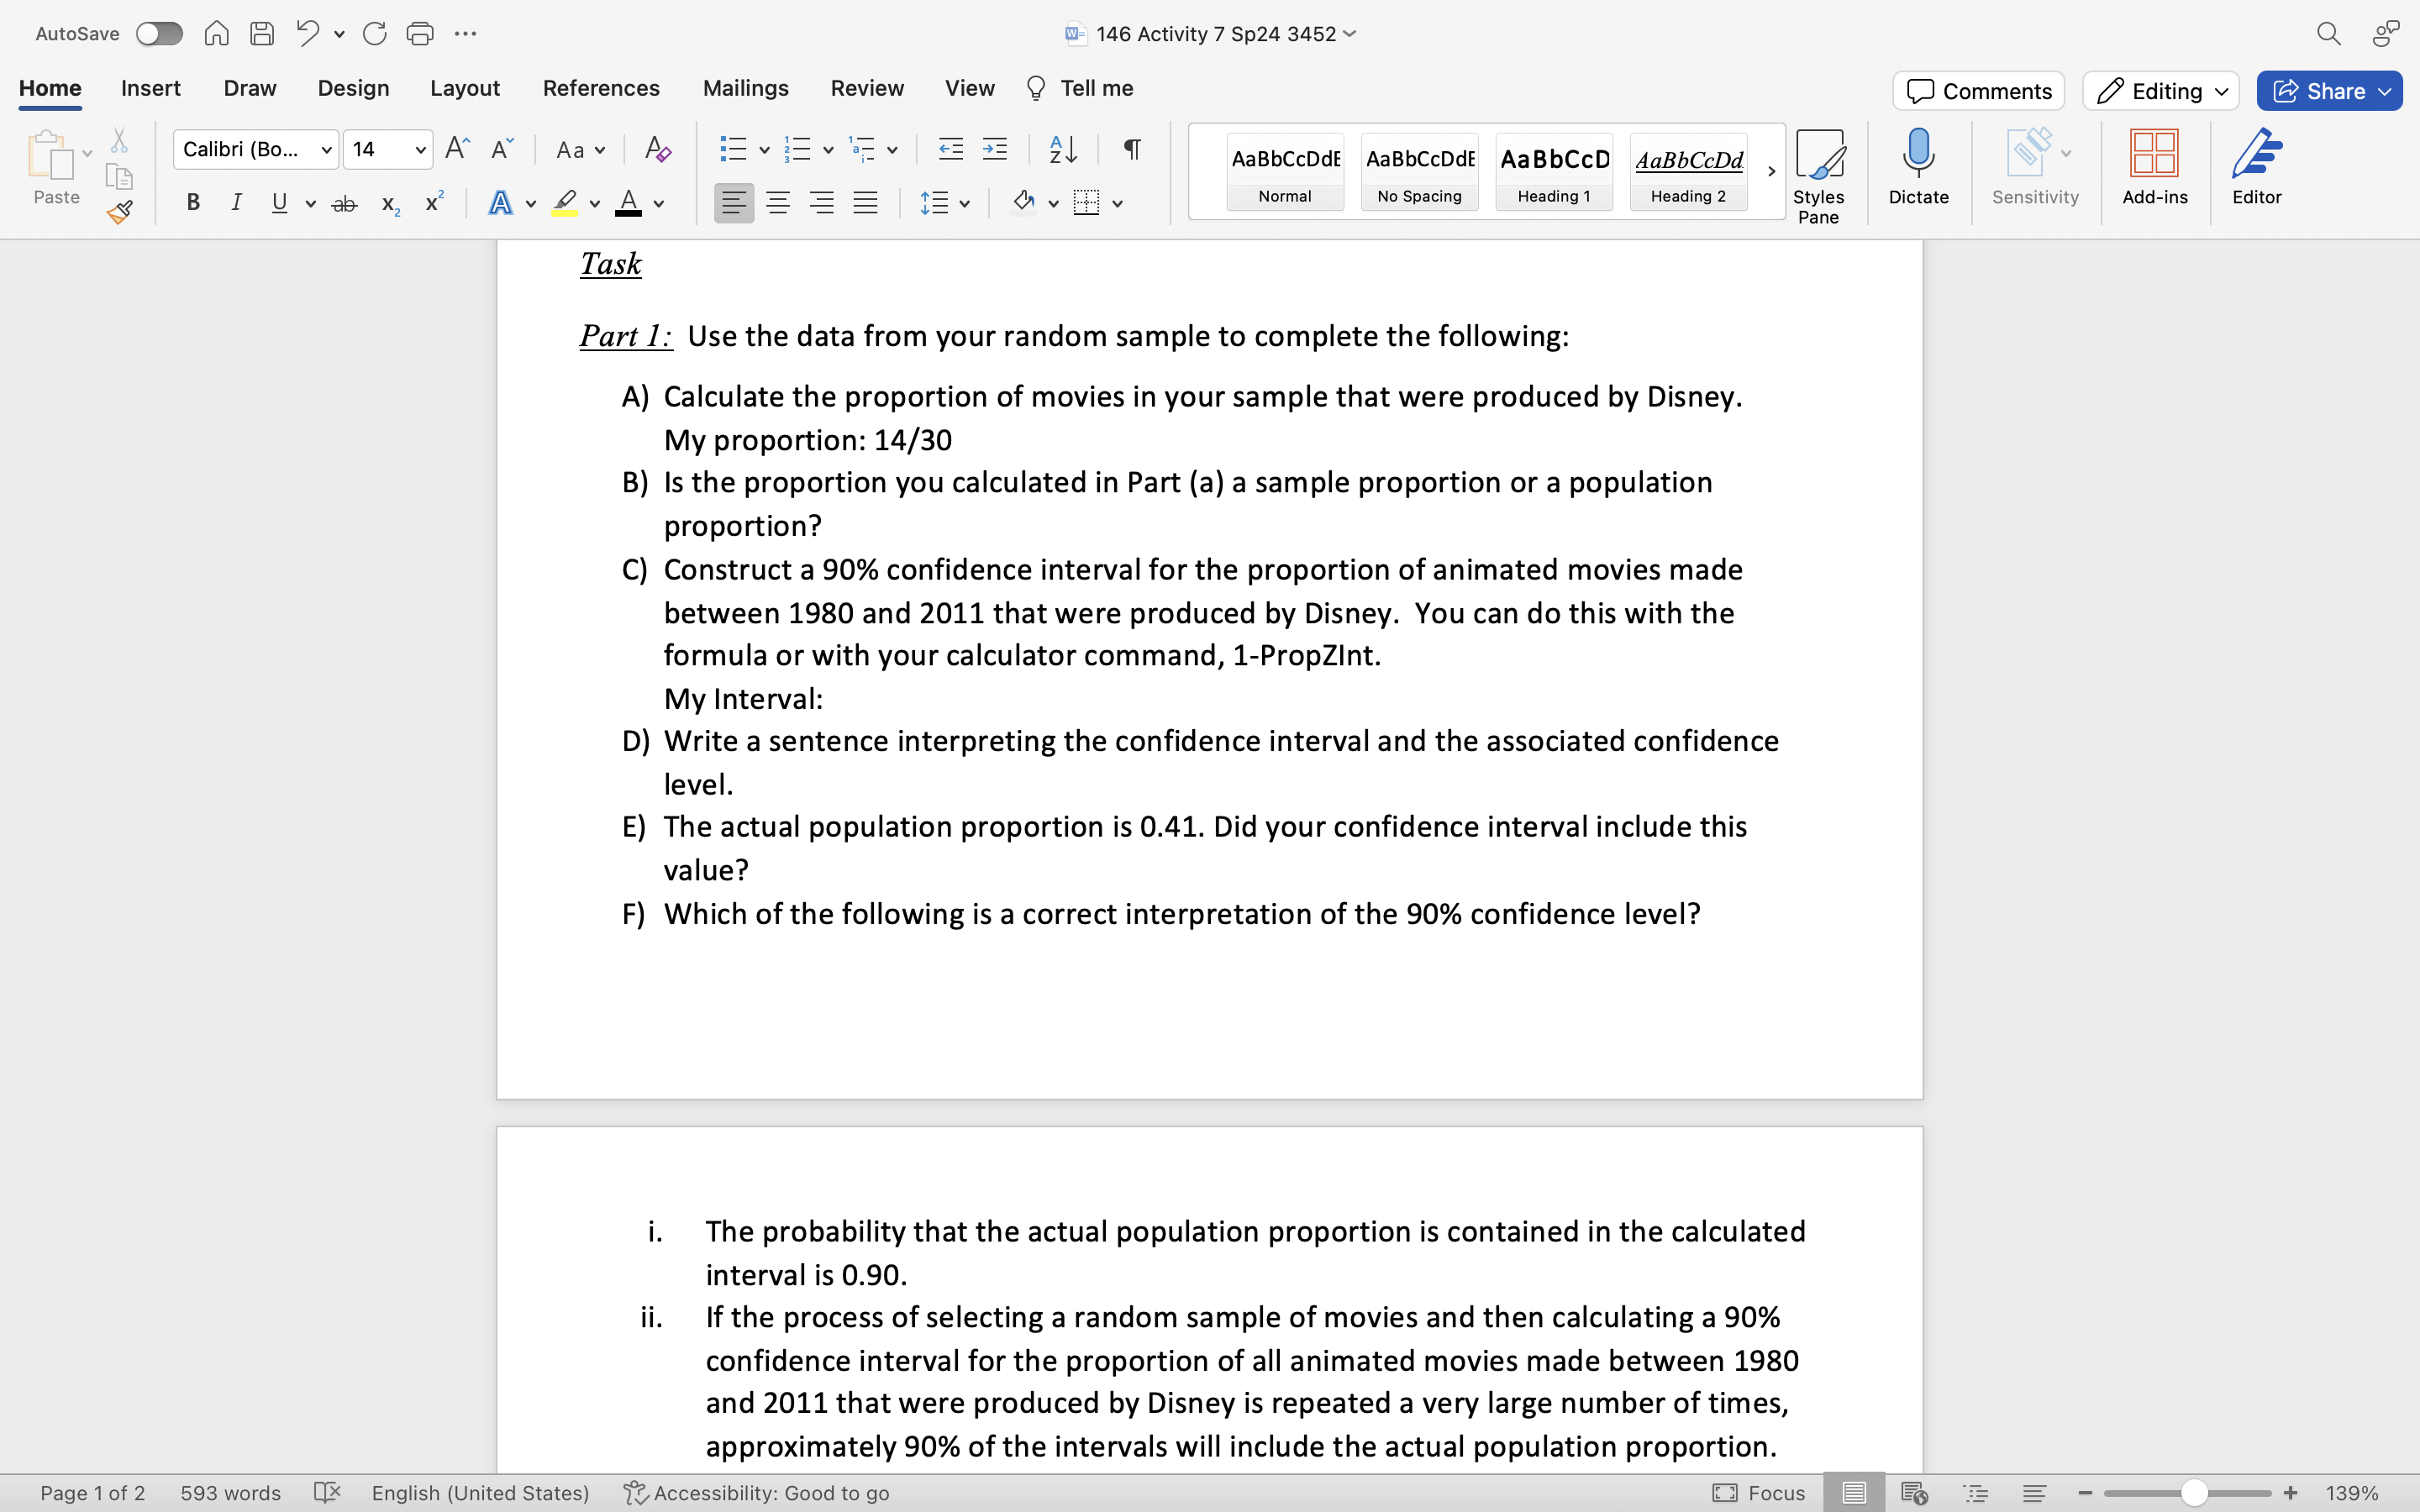
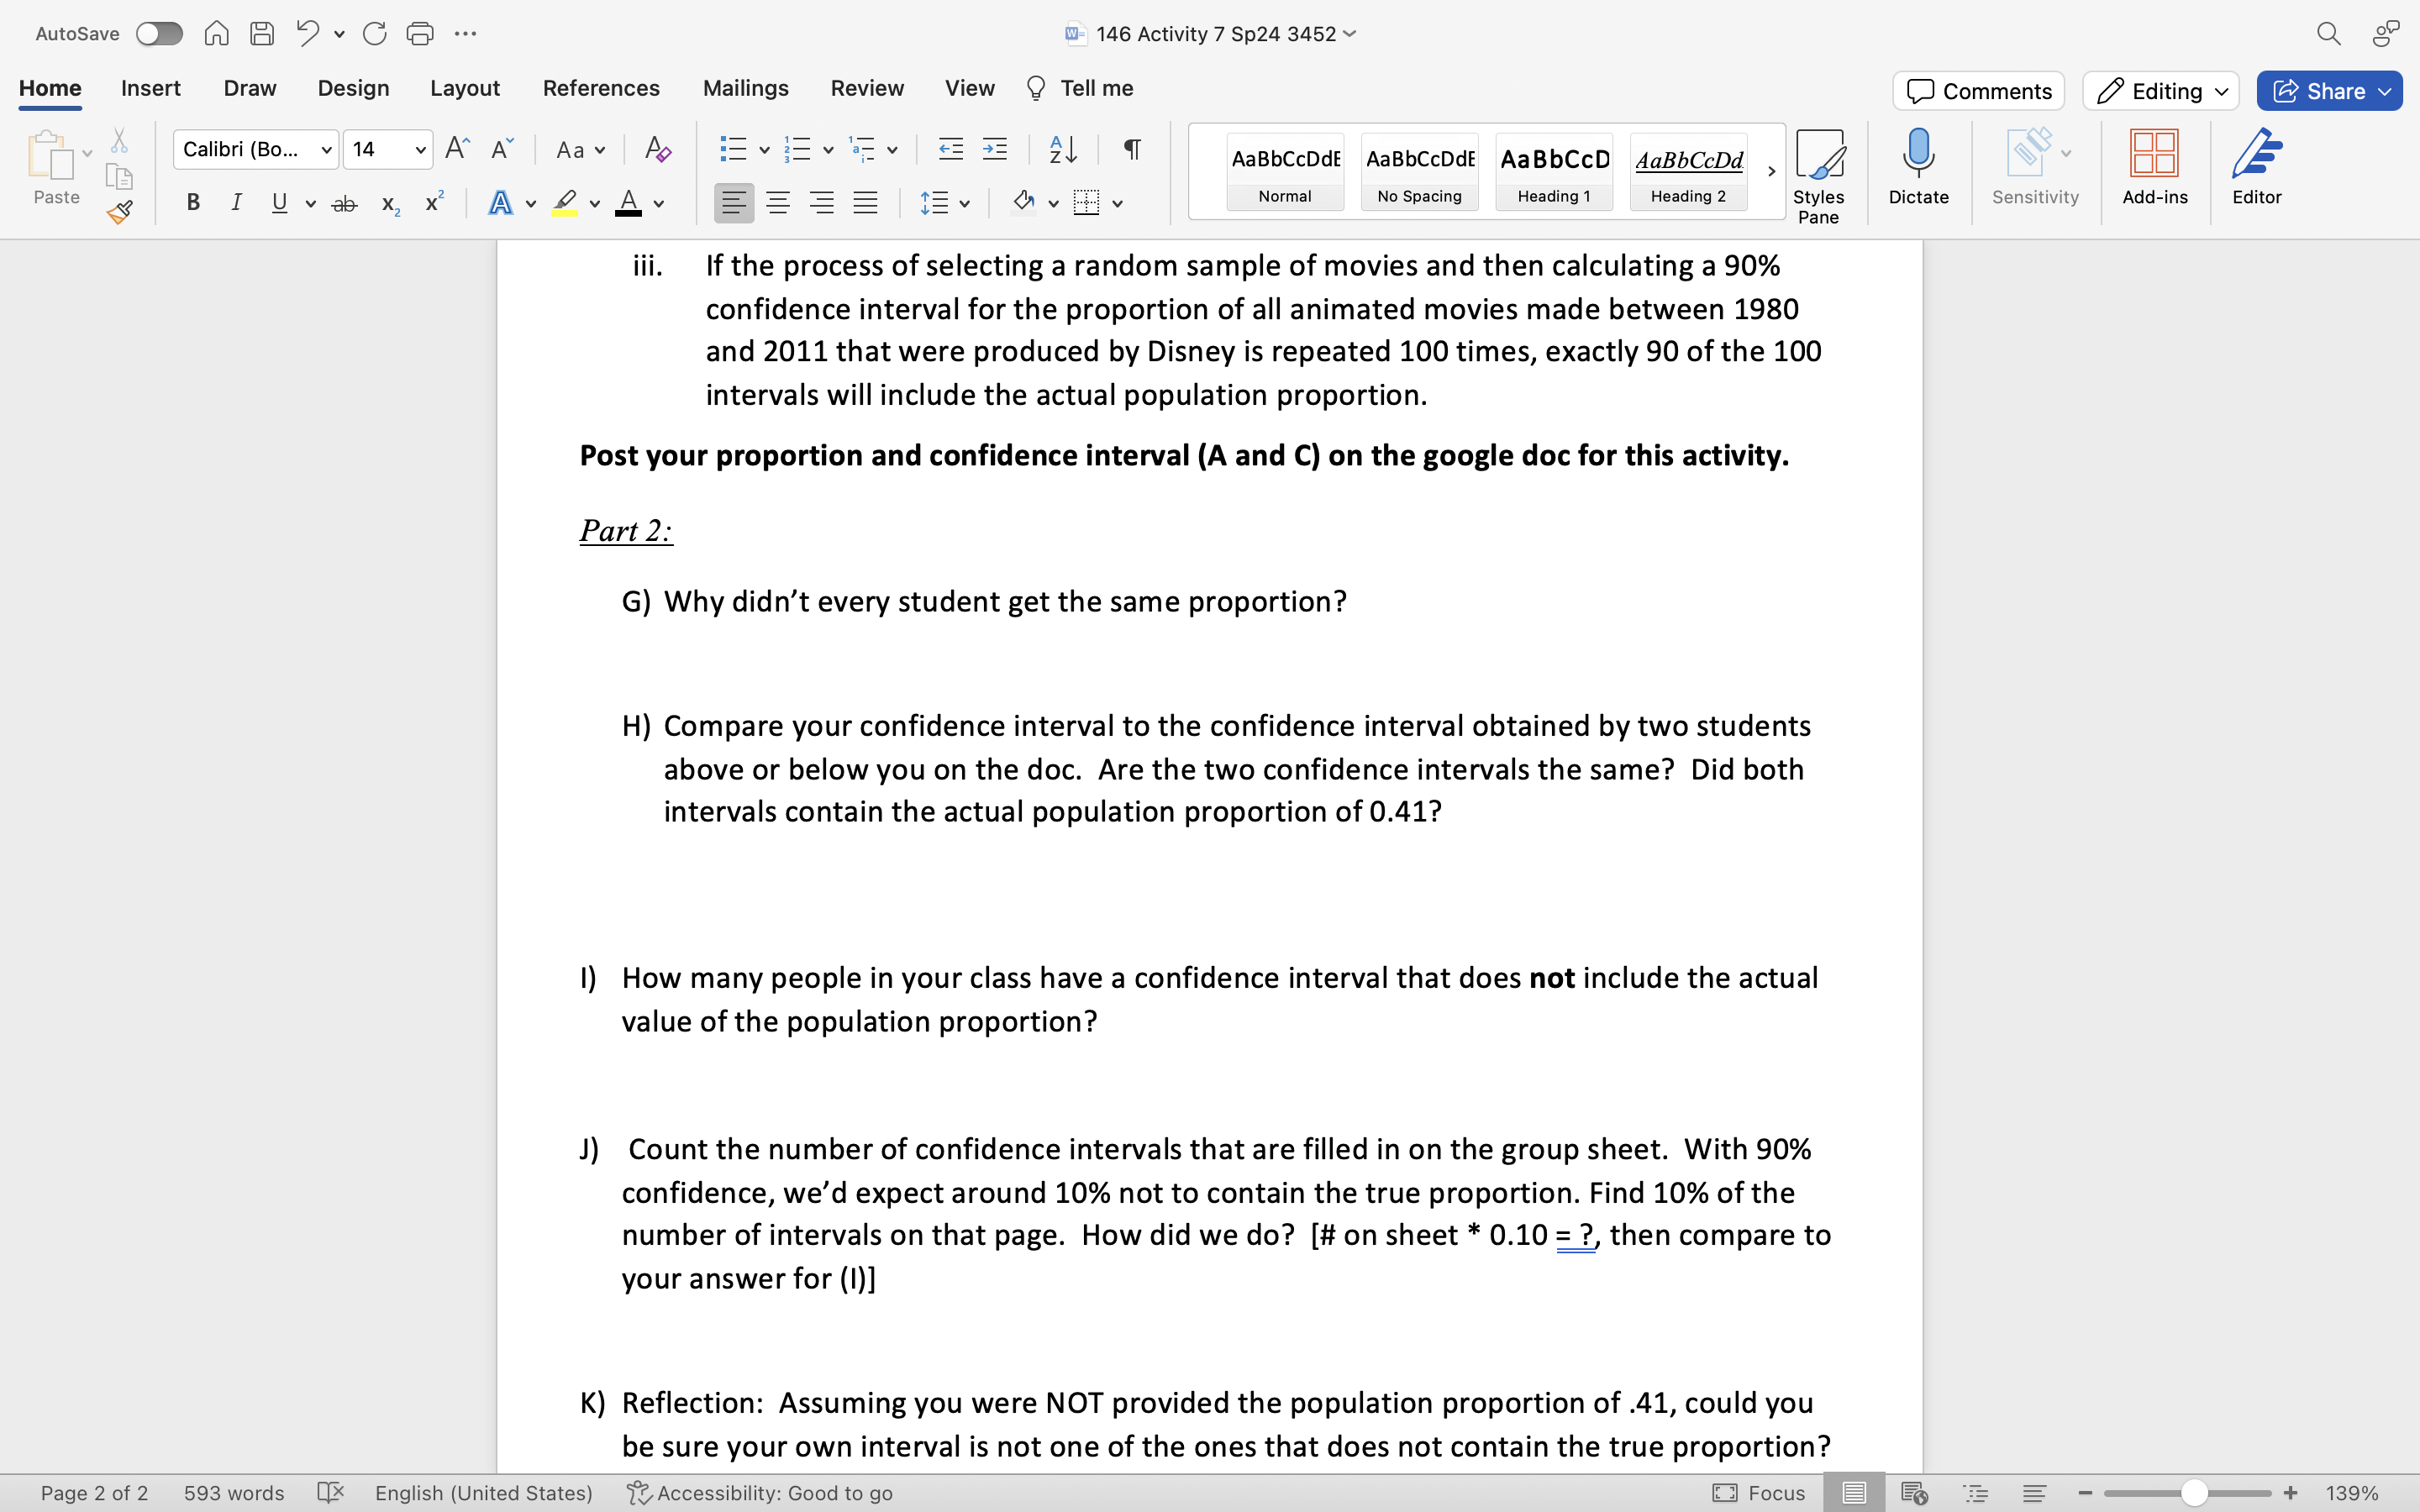
Shrek 2 Dreamworks Chicken Run Dreamworks A Bug's Life Disney Cars Disney Tim Burton's The Nightmare Before Christmas Disney Monsters Inc. Disney Meet the Robinsons Disney Curious George Universal Barnyard: The Original Party Animals Paramount Home on the Range Disney The Tale of Despereaux Universal Chicken Little Disney How to Train Your Dragon Paramount Ice Age: Dawn of the Dinosaurs Fox Fantasia 2000 Disney Monster House Dreamworks Tangled Disney Kung Fu Panda Paramount Flushed Away Paramount The Road to El Dorado Dreamworks Beavis and Butt-Head Do America Paramount Tarzan Disney The Lion King Disney The Little Mermaid Disney Happy Feet Warner Brothers Spirit: Stallion of the Cimarron Sony The Incredibles Disney The Adventures of Tintin Paramount Legends of the Guardians: The Owls of Ga'hoole Warner Brothers Return to Never Land DisneyAutoSave On A 5 . C G ... W- 146 Activity 7 Sp24 3452 ~ Home Insert Draw Design Layout References Mailings Review View ? Tell me Comments Editing Share Calibri (Bo... v 14 A" A Aa Ap EV EVEVEE AaBbCcDdE AaBbCcDdE AaBbCcD AaBbCcDd Paste BIUvab x x A DAY Norma No Spacing Heading 1 Heading 2 Styles Dictate Sensitivity Add-ins Editor pane Task Part 1: Use the data from your random sample to complete the following: A) Calculate the proportion of movies in your sample that were produced by Disney. My proportion: 14/30 B) Is the proportion you calculated in Part (a) a sample proportion or a population proportion? C) Construct a 90% confidence interval for the proportion of animated movies made between 1980 and 2011 that were produced by Disney. You can do this with the formula or with your calculator command, 1-PropZInt. My Interval: D) Write a sentence interpreting the confidence interval and the associated confidence level. E) The actual population proportion is 0.41. Did your confidence interval include this value? F) Which of the following is a correct interpretation of the 90% confidence level? i. The probability that the actual population proportion is contained in the calculated interval is 0.90. ii. If the process of selecting a random sample of movies and then calculating a 90% confidence interval for the proportion of all animated movies made between 1980 and 2011 that were produced by Disney is repeated a very large number of times, approximately 90% of the intervals will include the actual population proportion. Page 1 of 2 593 words X English (United States) { Accessibility: Good to go Focus + 139%Autesave (D () DY C @ - - 146 Activity 7 Sp24 3452 ~ Q& Home Insert Draw Design Layout References Mailings Review View Q Tell me C] Comments f Editing v & Share v ibri (AT = i= = e= = A Calibri (Bo.. v[14 v|A" A" | Aav | A | iEvicvimv | E = [ 9 AaBbCcDAE AaBbCcDAE AaBbCCD 4aBbCcDd , | 4/ \\Q/ O - Paste o B I Uva x X Av v A Bl = == =" Oy iy Normal No Spacing Heading 1 Heading 2 sptay:;s Dictate Sensitivity Add-ins Editor iii. If the process of selecting a random sample of movies and then calculating a 90% confidence interval for the proportion of all animated movies made between 1980 and 2011 that were produced by Disney is repeated 100 times, exactly 90 of the 100 intervals will include the actual population proportion. Post your proportion and confidence interval (A and C) on the google doc for this activity. Part 2: G) Why didn't every student get the same proportion? H) Compare your confidence interval to the confidence interval obtained by two students above or below you on the doc. Are the two confidence intervals the same? Did both intervals contain the actual population proportion of 0.41? 1) How many people in your class have a confidence interval that does not include the actual value of the population proportion? J) Count the number of confidence intervals that are filled in on the group sheet. With 90% confidence, we'd expect around 10% not to contain the true proportion. Find 10% of the number of intervals on that page. How did we do? [# on sheet * 0.10 = ?, then compare to your answer for (1)] K) Reflection: Assuming you were NOT provided the population proportion of .41, could you be sure your own interval is not one of the ones that does not contain the true proportion? + 139% (] j. iiit I 1 Page 2 of 2 593 words [ English (United States) f",Access\\'b\\lity: Good to go 3 Focus
Step by Step Solution
There are 3 Steps involved in it
Step: 1
Get Instant Access to Expert-Tailored Solutions
See step-by-step solutions with expert insights and AI powered tools for academic success
Step: 2
Step: 3
Ace Your Homework with AI
Get the answers you need in no time with our AI-driven, step-by-step assistance