Question
Shrieves Casting Company is considering adding a new line to its product mix, and the capital budgeting analysis is being conducted by Sidney Johnson, a
Shrieves Casting Company is considering adding a new line to its product mix, and the capital budgeting analysis is being conducted by Sidney Johnson, a recently graduated MBA. The production line would be set up in unused space in Shrievess main plant. The machinerys invoice price would be approximately $200,000, another $10,000 in shipping charges would be required, and it would cost an additional $30,000 to install the equipment. The machinery has an economic life of 4 years, and Shrieves has obtained a special tax ruling that places the equipment in the MACRS 3-year class. The machinery is expected to have a salvage value of $25,000 after 4 years of use. The new line would generate incremental sales of 1,250 units per year for 4 years at an incremental cost of $100 per unit in the first year, excluding depreciation. Each unit can be sold for $200 in the first year. The sales price and cost are both expected to increase by 3% per year due to inflation. Further, to handle the new line, the firms net working capital would have to increase by an amount equal to 12% of sales revenues. The firms tax rate is 40%. They do not use short-term interest-bearing debt on a permanent basis so the current price from a 12% coupon, semiannual payment, noncallable bond with 15 years remaining is $1,153.72 - but the current price of firm's is 10%, 100 par, annual dividend, preferred stock of $116.95. As well as common stock is selling at $50 per share, beta is 1.2 and the yield on bonds is 2.6% (risk-free rates) with a market risk premium to be 7%. Target structure is 30% long-term debt, 10% preferred stock and 60% common equity. How should they proceed?


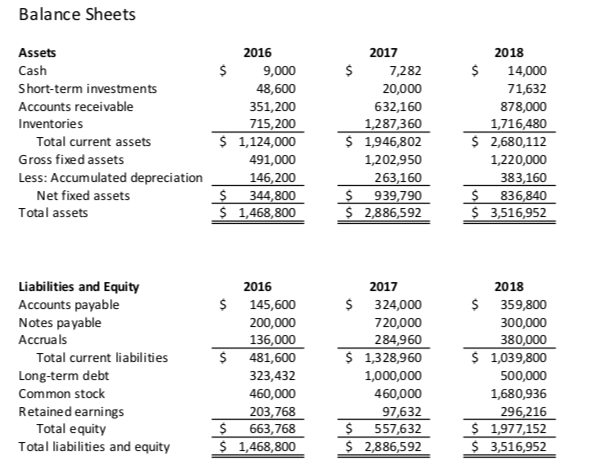
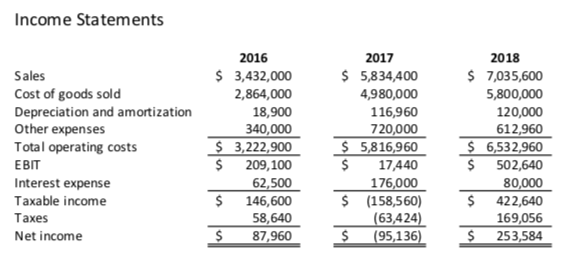
The financial statements for the past three years are included. For the first part of your project, you need to thoroughly analyze these statements. You should create common size statements and compute key ratios.
Balance Sheets Assets 2016 2017 2018 Cash 9,000 7,282 14,000 Short-term investments 48,600 20,000 71,632 Accounts receivable 351,200 632,160 878,000 Inventories 715,200 $ 1,124,000 1,287,360 $ 1,946,802 1,716,480 $ 2,680,112 1,220,000 Total current assets Gross fixed assets 491,000 1,202,950 Less: Accumulated depreciation 263,160 939,790 $2,886,592 383,160 836,840 $ 3,516,952 146,200 $ 344,800 $ 1,468,800 Net fixed assets Total assets Liabilities and Equity Accounts payable Notes payable 2016 2017 2018 $324,000 $ 359,800 145,600 200,000 720,000 300,000 Accruals 136,000 284,960 $ 1,328,960 380,000 $1,039,800 Total current liabil iti es 481,600 Long-term debt 323,432 460,000 1,000,000 500,000 Common stock 460,000 1,680,936 Retained earnings Total equity Total liabilities and equity 97,632 557,632 $ 2,886,592 296,216 $ 1,977,152 $3,516,952 203,768 $ 663,768 $ 1,468,800 Income Statements 2017 2016 2018 $ 3,432,000 $ 7,035,600 5,800,000 120,000 612,960 $ 6,532,960 $ 502,640 Sales $5,834,400 Cost of goods sold Depreciation and amortization Other expenses Total operating costs 2,864,000 4,980,000 18,900 116,960 340,000 $ 3,222,900 $ 720,000 $ 5,816,960 17,440 176,000 $ (158,560) (63,424) (95,136) T 209,100 62,500 146,600 58,640 87,960 Interest expense 80,000 $422,640 Taxable income es 169,056 253,584 Net income Balance Sheets Assets 2016 2017 2018 Cash 9,000 7,282 14,000 Short-term investments 48,600 20,000 71,632 Accounts receivable 351,200 632,160 878,000 Inventories 715,200 $ 1,124,000 1,287,360 $ 1,946,802 1,716,480 $ 2,680,112 1,220,000 Total current assets Gross fixed assets 491,000 1,202,950 Less: Accumulated depreciation 263,160 939,790 $2,886,592 383,160 836,840 $ 3,516,952 146,200 $ 344,800 $ 1,468,800 Net fixed assets Total assets Liabilities and Equity Accounts payable Notes payable 2016 2017 2018 $324,000 $ 359,800 145,600 200,000 720,000 300,000 Accruals 136,000 284,960 $ 1,328,960 380,000 $1,039,800 Total current liabil iti es 481,600 Long-term debt 323,432 460,000 1,000,000 500,000 Common stock 460,000 1,680,936 Retained earnings Total equity Total liabilities and equity 97,632 557,632 $ 2,886,592 296,216 $ 1,977,152 $3,516,952 203,768 $ 663,768 $ 1,468,800 Income Statements 2017 2016 2018 $ 3,432,000 $ 7,035,600 5,800,000 120,000 612,960 $ 6,532,960 $ 502,640 Sales $5,834,400 Cost of goods sold Depreciation and amortization Other expenses Total operating costs 2,864,000 4,980,000 18,900 116,960 340,000 $ 3,222,900 $ 720,000 $ 5,816,960 17,440 176,000 $ (158,560) (63,424) (95,136) T 209,100 62,500 146,600 58,640 87,960 Interest expense 80,000 $422,640 Taxable income es 169,056 253,584 Net incomeStep by Step Solution
There are 3 Steps involved in it
Step: 1

Get Instant Access to Expert-Tailored Solutions
See step-by-step solutions with expert insights and AI powered tools for academic success
Step: 2

Step: 3

Ace Your Homework with AI
Get the answers you need in no time with our AI-driven, step-by-step assistance
Get Started


