

Answered step by step
Verified Expert Solution
Question
1 Approved Answer
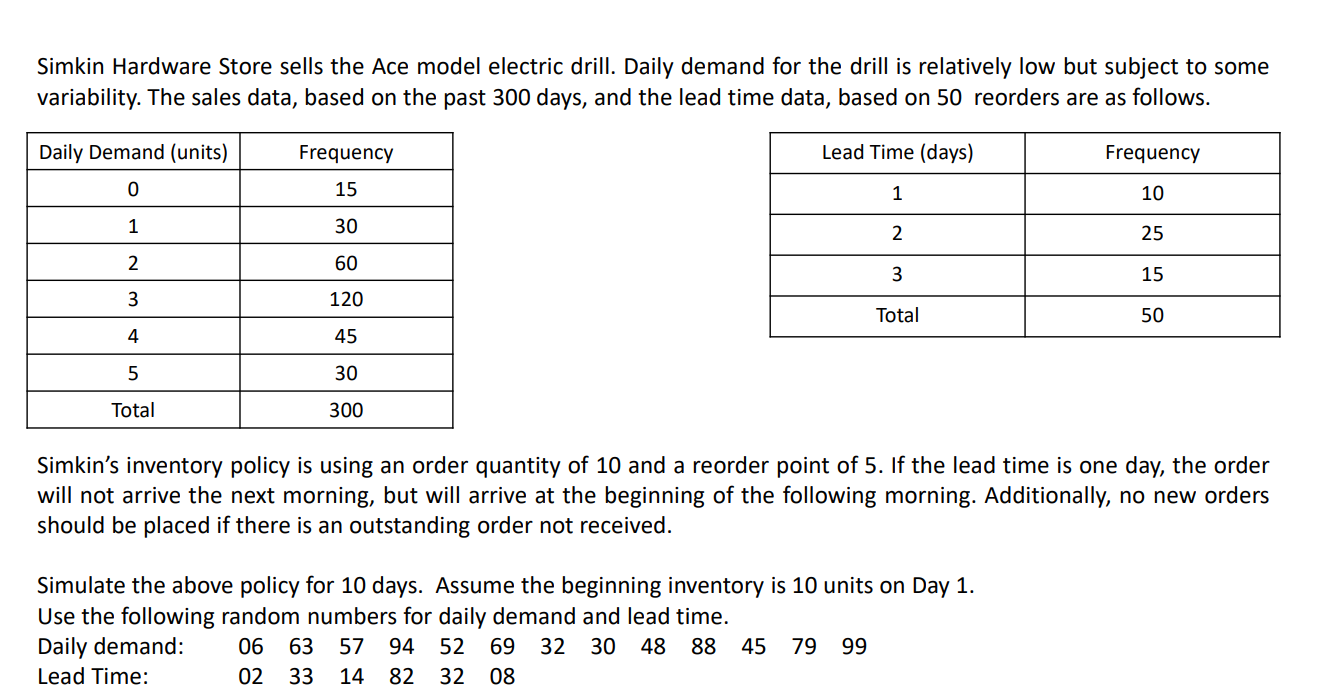
Simkin Hardware Store sells the Ace model electric drill. Daily demand for the drill is relatively low but subject to some variability. The sales data,
Step by Step Solution
There are 3 Steps involved in it
Step: 1

Get Instant Access to Expert-Tailored Solutions
See step-by-step solutions with expert insights and AI powered tools for academic success
Step: 2

Step: 3
Ace Your Homework with AI
Get the answers you need in no time with our AI-driven, step-by-step assistance
Get Started
Rising From The Mailroom To The Boardroom Unique Insights For Governance Risk Compliance And Audit Leaders
Authors: Bruce Turner
1st Edition
1032042907, 978-1032042909