

Answered step by step
Verified Expert Solution
Question
1 Approved Answer
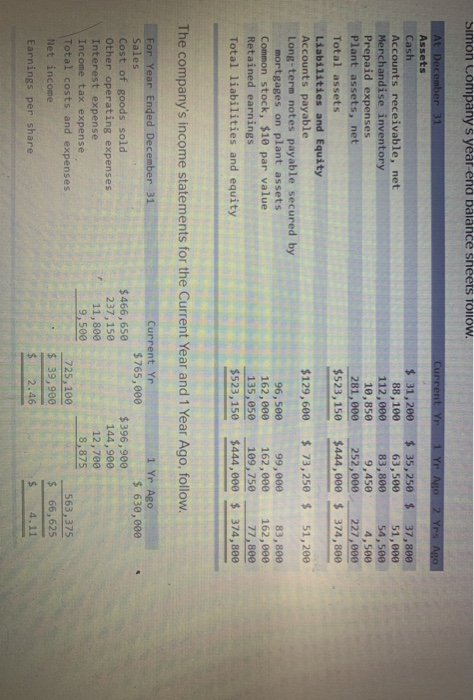
Simon Company s year-end palance sheets rollOW. Current Yr 1 Yr AO 2 Yrs Ago At December 31 Assets Cash Accounts receivable, net Merchandise inventory
Step by Step Solution
There are 3 Steps involved in it
Step: 1

Get Instant Access to Expert-Tailored Solutions
See step-by-step solutions with expert insights and AI powered tools for academic success
Step: 2

Step: 3
Ace Your Homework with AI
Get the answers you need in no time with our AI-driven, step-by-step assistance
Get Started
Sustainability Success In Business A Practical Guide To Managing Climate Risk In Your Organisation
Authors: Megyn Carpenter
1922375209, 978-1922375209