

Answered step by step
Verified Expert Solution
Question
1 Approved Answer
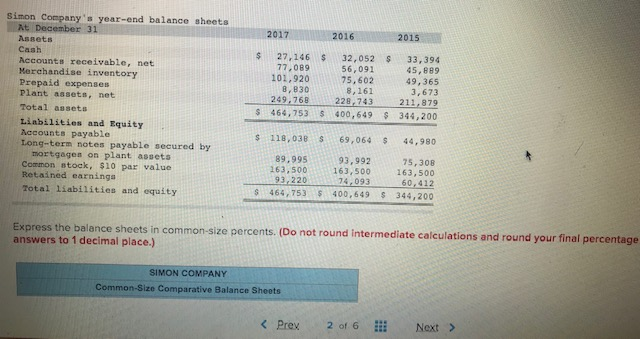
Simon Company's year-end balance sheets At December 31 2017 2016 2015 Asnets Cash 33,394 45,889 49,365 3,673 27,146 77,089 101,920 8,830 249,768 32,052 56,091 75,602
Step by Step Solution
There are 3 Steps involved in it
Step: 1

Get Instant Access to Expert-Tailored Solutions
See step-by-step solutions with expert insights and AI powered tools for academic success
Step: 2

Step: 3
Ace Your Homework with AI
Get the answers you need in no time with our AI-driven, step-by-step assistance
Get Started
New Horizons In The Field Of Management Audit As A Tool For Improving The Overall Management Of Enterprises A Guideline For Good Governance
Authors: Mohammed Sakhawat Hossain
1st Edition
3639194454, 978-3639194456