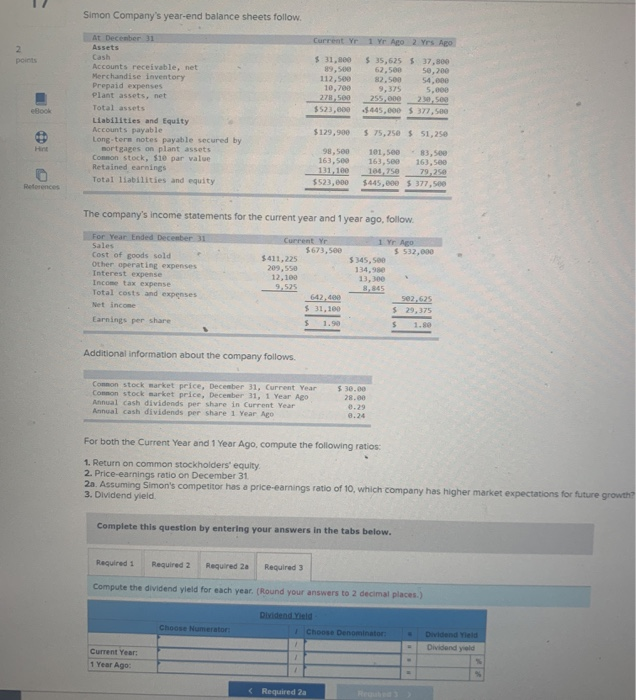
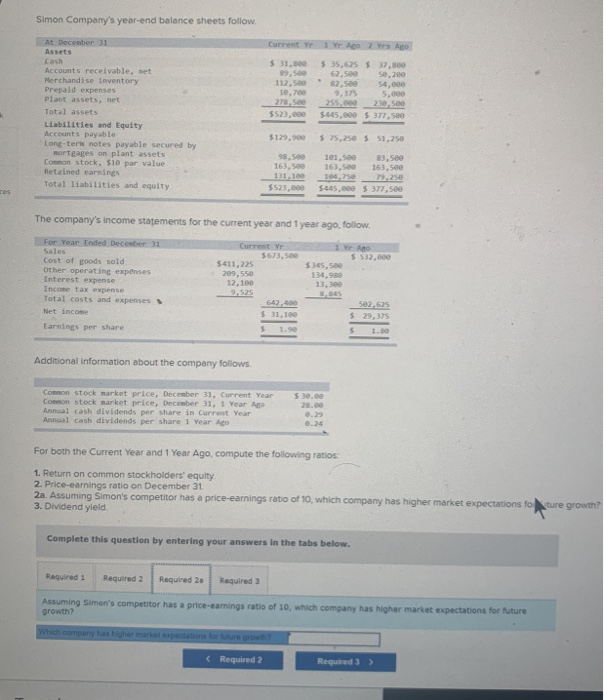
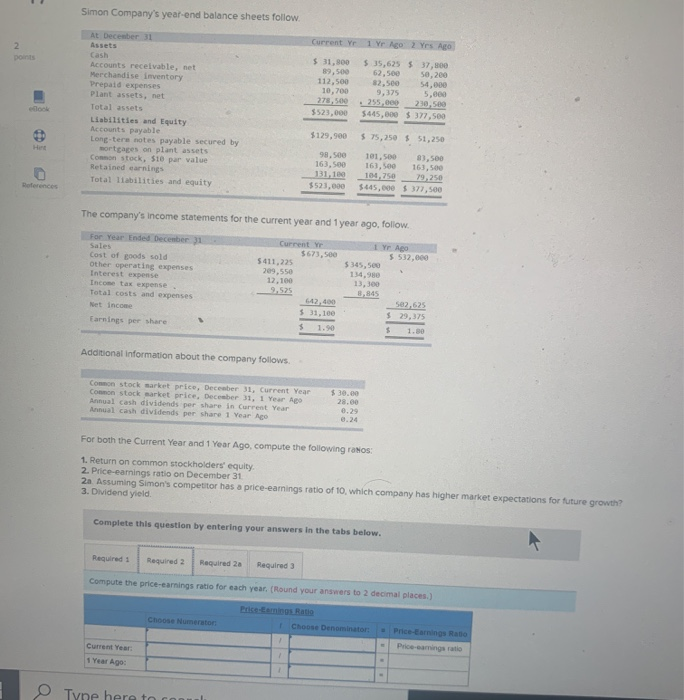
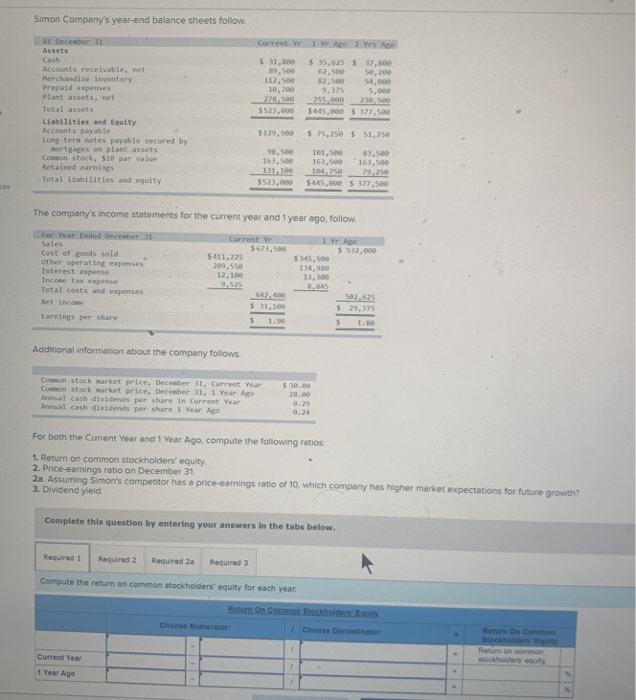
Simon Company's year-end balance sheets follow 2 points At December 31 Assets Cash Accounts receivable, net Merchandise inventory Prepaid expenses plant assets, net Total assets Liabilities and Equity Accounts payable Long-term notes payable secured by mortgages on plant assets Common stock, $10 par value Retained earnings Total liabilities and equity Current Y 1 Yr ABO 2 Yrs Ago $ 31,800 $ 35,625 $37.800 89,500 62,500 50,200 112,500 82.500 54,000 10,700 9.375 5.000 278,500 255,000 20.500 $523.000 $445,000 5 377,500 eBook $129,900 $ 75,250 $ 51,250 Hint 0 98,500 163,500 131,180 $523,000 101,500 83,500 163,500 163, see 100.75e 79.25 $445.000 $ 377,500 Reference The company's income statements for the current year and 1 year ago, follow For Year Ended December 31 Sales Cost of goods sold other operating expenses Interest expense Income tax expense Total costs and expenses Net income Current Yr $673,500 $411,225 209,550 12,100 9.525 642,00 $ 31,100 5 1.90 1 Yr A $ 532,000 $ 345,500 134.90 13,300 502.625 $ 29,375 Earnings per share 5 1. Additional information about the company follows Common stock market price, December 31, Current Year Common stock market price, December 31, 1 Year Ago Annual cash dividends per share in Current Year Annual cash dividends per share 1 Year Ago $ 30.00 28.00 0.29 8.24 For both the Current Year and 1 Year Ago, compute the following ratios 1. Return on common stockholders' equity 2. Price-earnings ratio on December 31 20. Assuming Simon's competitor has a price-earnings ratio of 10, which company has higher market expectations for future growth 3. Dividend yield Complete this question by entering your answers in the tabs below. Required 1 Required 2 Required 2 Required 3 Compute the dividend yield for each year. (Round your answers to 2 decimal places.) Choose Numerator Dividend Yield Choose Denominator Dividend Yield Dividend yold Current Year: 1 Year Ago Simon Company's year-end balance sheets follow. Current Ye 1 Yr Ago 2 Yes Ago 2 po At December 31 Assets Cash Accounts receivable, net Merchandise inventory prepaid expenses Plant assets, net Total assets Liabilities and Equity Accounts payable Long-tere notes payable secured by mortgages on plant assets Common stock, $10 par value Retained earnings Total liabilities and equity $ 31,900 89,500 112,500 10,700 278,500 $523,000 $ 35,625 $ 37,00 62,500 50,200 32.500 54,000 9,375 5,000 210.500 5445,000 $ 377,500 $129,900 $ 75,250 $ 51,250 98.500 163,500 31.10 $523,000 101,500 33,500 163,500 163,500 100.750 29,250 $445,000$ 377,500 Detences The company's income statements for the current year and 1 year ago, follow For Year Ended December 31 Sales Cost of goods sold other operating expenses Interest expense Income tax expense Total costs and expenses Net Income Earnings per share Current Yr $673, see 5 411,225 209,550 12.100 1 YAO $ 532.000 $345,500 134,980 13,300 8,845 502,625 $ 29,375 42,400 $31,100 $ 1.90 $ 1.90 Additional information about the company follows Common stock market price, December 31, Current Year Common stock market price, December 31, 1 Year A Annual cash dividends per share in Current Year Annual cash dividends per Share 1 Year Ago $30.00 28.00 0.29 0.24 For both the Current Year and 1 Year Ago, compute the following ros: 1. Return on common stockholders' equity 2. Price-earnings ratio on December 31 21 Assuming Simon's competitor has a price-earings ratio of 10, which company has higher market expectations for future growth? 3. Dividend yield Complete this question by entering your answers in the tabs below. Required Required 2 Required 20 Required 3 Compute the price earnings ratio for each year. (Round your answers to 2 decimal places) Choose Numerator Choose Denominator Price Earnings Ratio Price-caminar Current Year 1 Year Ago O Tyne here to Simon Company's year-end balance sheets follow. Current Yr 1 yr Ago 2 Vrs Ago At December 31 Assets Cash Accounts receivable, net Merchandise inventory Prepaid expenses Plant assets, net Total assets Liabilities and Equity Accounts payable Long-tern notes payable secured by mortgages on plant assets Connon stock, $10 par value Retained earnings Total liabilities and equity $ 31,00 89,500 112,500 10,700 278,500 $523,000 $ 35,625 $ 37,800 62,500 50,200 32,500 50.000 9,375 5,000 255.00 210, 500 $445,000 5 377,500 $129,900 $ 75,250 $ 51,250 98,500 163,500 131, 100 $523,000 101,500 83,50 163,500 163.500 10.250 $445.000$ 377,500 The company's income statements for the current year and 1 year ago, follow For Year Ended December 31 Sales Cost of goods sold other operating expenses Teterest expense Income tax expense Total costs and expenses Net income Earnings per share Current Yr $673,500 5411,25 209,550 12,180 1 yr ago $ 532,000 $345,500 134,980 13,300 8,805 502.625 $ 29,375 $ 1.30 642,00 $1,100 $ 1.90 Additional information about the company follows. Common stock market price, December 31, Current Year Common stock market price, December 31. 1 Year Ago Annual cash dividends per share in Current Year Annual cash dividends per share 1 Year Ago $ 30.00 28.00 8.29 0.24 For both the Current Year and 1 Year Ago, compute the following ratios 1. Return on common stockholders' equity 2. Price-earnings ratio on December 31 20. Assuming Simon's competitor has a price-earnings ratio of 10, which company has higher market expectations for future growth? 3. Dividend yield Complete this question by entering your answers in the tabs below. Required 1 Required 2 Required 2a Required 3 Compute the return on common stockholders' equity for each year Return On Common Stockholders Equity Choose Numerator Choose Denominator: Return on Com Stockholders' Equity Rumon common stockholders equity Current Year 1 Year Ago 1 Simon Company's year-end balance sheets follow 2 points At December 31 Assets Cash Accounts receivable, net Merchandise inventory Prepaid expenses plant assets, net Total assets Liabilities and Equity Accounts payable Long-term notes payable secured by mortgages on plant assets Common stock, $10 par value Retained earnings Total liabilities and equity Current Y 1 Yr ABO 2 Yrs Ago $ 31,800 $ 35,625 $37.800 89,500 62,500 50,200 112,500 82.500 54,000 10,700 9.375 5.000 278,500 255,000 20.500 $523.000 $445,000 5 377,500 eBook $129,900 $ 75,250 $ 51,250 Hint 0 98,500 163,500 131,180 $523,000 101,500 83,500 163,500 163, see 100.75e 79.25 $445.000 $ 377,500 Reference The company's income statements for the current year and 1 year ago, follow For Year Ended December 31 Sales Cost of goods sold other operating expenses Interest expense Income tax expense Total costs and expenses Net income Current Yr $673,500 $411,225 209,550 12,100 9.525 642,00 $ 31,100 5 1.90 1 Yr A $ 532,000 $ 345,500 134.90 13,300 502.625 $ 29,375 Earnings per share 5 1. Additional information about the company follows Common stock market price, December 31, Current Year Common stock market price, December 31, 1 Year Ago Annual cash dividends per share in Current Year Annual cash dividends per share 1 Year Ago $ 30.00 28.00 0.29 8.24 For both the Current Year and 1 Year Ago, compute the following ratios 1. Return on common stockholders' equity 2. Price-earnings ratio on December 31 20. Assuming Simon's competitor has a price-earnings ratio of 10, which company has higher market expectations for future growth 3. Dividend yield Complete this question by entering your answers in the tabs below. Required 1 Required 2 Required 2 Required 3 Compute the dividend yield for each year. (Round your answers to 2 decimal places.) Choose Numerator Dividend Yield Choose Denominator Dividend Yield Dividend yold Current Year: 1 Year Ago Simon Company's year-end balance sheets follow. Current Ye 1 Yr Ago 2 Yes Ago 2 po At December 31 Assets Cash Accounts receivable, net Merchandise inventory prepaid expenses Plant assets, net Total assets Liabilities and Equity Accounts payable Long-tere notes payable secured by mortgages on plant assets Common stock, $10 par value Retained earnings Total liabilities and equity $ 31,900 89,500 112,500 10,700 278,500 $523,000 $ 35,625 $ 37,00 62,500 50,200 32.500 54,000 9,375 5,000 210.500 5445,000 $ 377,500 $129,900 $ 75,250 $ 51,250 98.500 163,500 31.10 $523,000 101,500 33,500 163,500 163,500 100.750 29,250 $445,000$ 377,500 Detences The company's income statements for the current year and 1 year ago, follow For Year Ended December 31 Sales Cost of goods sold other operating expenses Interest expense Income tax expense Total costs and expenses Net Income Earnings per share Current Yr $673, see 5 411,225 209,550 12.100 1 YAO $ 532.000 $345,500 134,980 13,300 8,845 502,625 $ 29,375 42,400 $31,100 $ 1.90 $ 1.90 Additional information about the company follows Common stock market price, December 31, Current Year Common stock market price, December 31, 1 Year A Annual cash dividends per share in Current Year Annual cash dividends per Share 1 Year Ago $30.00 28.00 0.29 0.24 For both the Current Year and 1 Year Ago, compute the following ros: 1. Return on common stockholders' equity 2. Price-earnings ratio on December 31 21 Assuming Simon's competitor has a price-earings ratio of 10, which company has higher market expectations for future growth? 3. Dividend yield Complete this question by entering your answers in the tabs below. Required Required 2 Required 20 Required 3 Compute the price earnings ratio for each year. (Round your answers to 2 decimal places) Choose Numerator Choose Denominator Price Earnings Ratio Price-caminar Current Year 1 Year Ago O Tyne here to Simon Company's year-end balance sheets follow. Current Yr 1 yr Ago 2 Vrs Ago At December 31 Assets Cash Accounts receivable, net Merchandise inventory Prepaid expenses Plant assets, net Total assets Liabilities and Equity Accounts payable Long-tern notes payable secured by mortgages on plant assets Connon stock, $10 par value Retained earnings Total liabilities and equity $ 31,00 89,500 112,500 10,700 278,500 $523,000 $ 35,625 $ 37,800 62,500 50,200 32,500 50.000 9,375 5,000 255.00 210, 500 $445,000 5 377,500 $129,900 $ 75,250 $ 51,250 98,500 163,500 131, 100 $523,000 101,500 83,50 163,500 163.500 10.250 $445.000$ 377,500 The company's income statements for the current year and 1 year ago, follow For Year Ended December 31 Sales Cost of goods sold other operating expenses Teterest expense Income tax expense Total costs and expenses Net income Earnings per share Current Yr $673,500 5411,25 209,550 12,180 1 yr ago $ 532,000 $345,500 134,980 13,300 8,805 502.625 $ 29,375 $ 1.30 642,00 $1,100 $ 1.90 Additional information about the company follows. Common stock market price, December 31, Current Year Common stock market price, December 31. 1 Year Ago Annual cash dividends per share in Current Year Annual cash dividends per share 1 Year Ago $ 30.00 28.00 8.29 0.24 For both the Current Year and 1 Year Ago, compute the following ratios 1. Return on common stockholders' equity 2. Price-earnings ratio on December 31 20. Assuming Simon's competitor has a price-earnings ratio of 10, which company has higher market expectations for future growth? 3. Dividend yield Complete this question by entering your answers in the tabs below. Required 1 Required 2 Required 2a Required 3 Compute the return on common stockholders' equity for each year Return On Common Stockholders Equity Choose Numerator Choose Denominator: Return on Com Stockholders' Equity Rumon common stockholders equity Current Year 1 Year Ago 1