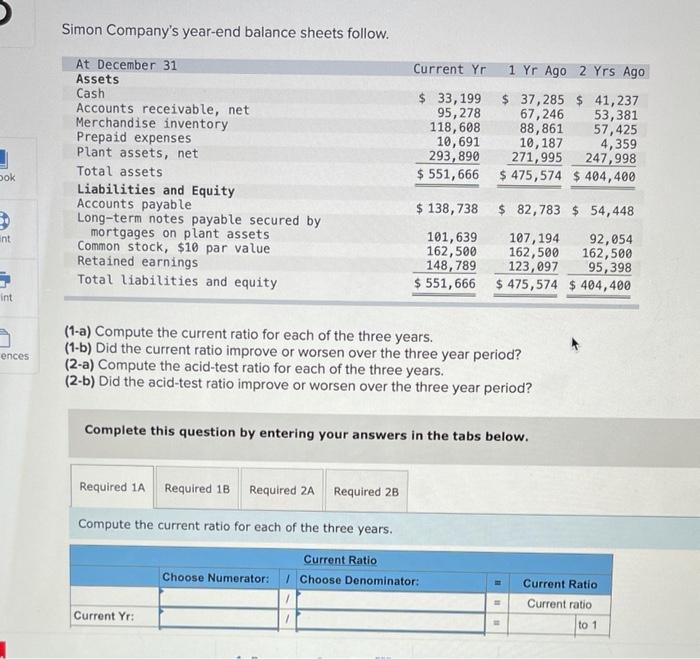
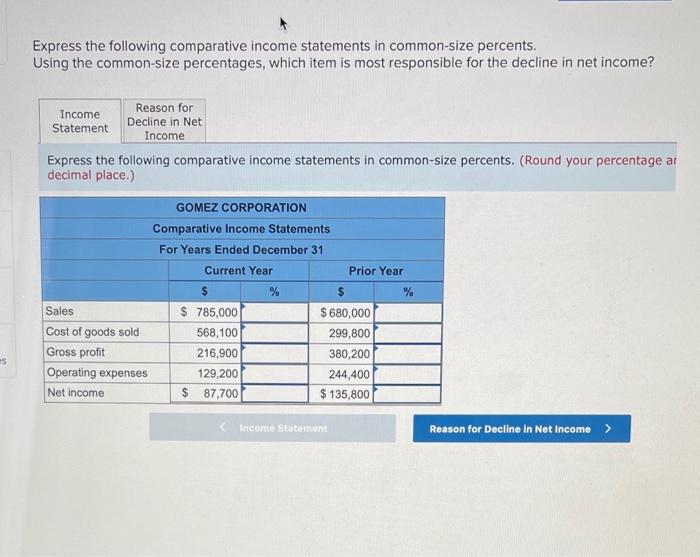
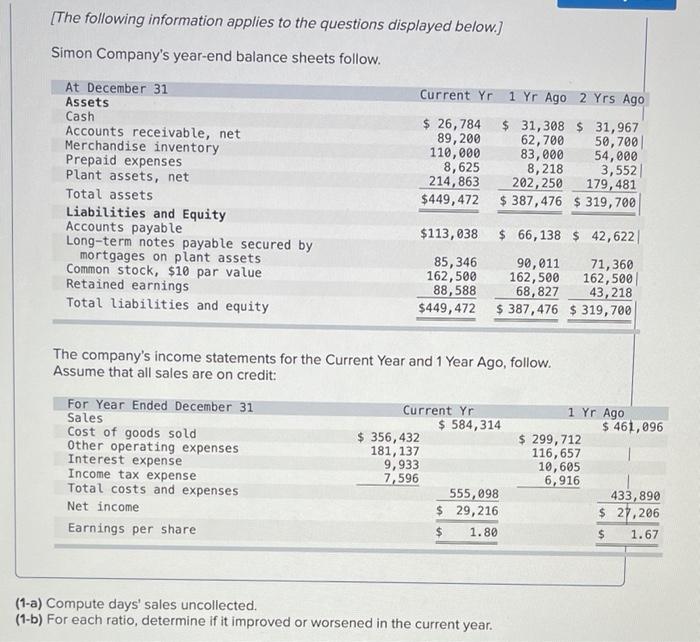
Simon Company's year-end balance sheets follow. At December 31 Assets Cash Accounts receivable, net Merchandise inventory Prepaid expenses Plant assets, net Total assets Liabilities and Equity Accounts payable Long-term notes payable secured by mortgages on plant assets Common stock, $10 par value Retained earnings Total liabilities and equity Current Yr 1 Yr Ago 2 Yrs Ago $ 33,199 $ 37,285 $ 41,237 95,278 67,246 53,381 118,608 88, 861 57,425 10,691 10,187 4,359 293, 890 271,995 247,998 $ 551,666 $ 475,574 $ 404,400 ook nt $ 138,738 $ 82,783 $ 54,448 101,639 107,194 92,054 162,500 162,500 162,500 148,789 123,097 95,398 $ 551, 666 $475,574 $ 404,400 int ences (1-a) Compute the current ratio for each of the three years. (1-b) Did the current ratio improve or worsen over the three year period? (2-a) Compute the acid-test ratio for each of the three years. (2-b) Did the acid-test ratio improve or worsen over the three year period? Complete this question by entering your answers in the tabs below. Required 1A Required 1B Required 2A Required 2B Compute the current ratio for each of the three years. Current Ratio 1 Choose Denominator: Choose Numerator: Current Ratio Current ratio Current Yr: to 1 Express the following comparative income statements in common-size percents, Using the common-size percentages, which item is most responsible for the decline in net income? Income Reason for Statement Decline in Net Income Express the following comparative income statements in common-size percents. (Round your percentage ar decimal place.) GOMEZ CORPORATION Comparative Income Statements For Years Ended December 31 Current Year Prior Year $ % % Sales $ 785,000 $ 680,000 Cost of goods sold 568,100 299,800 Gross profit 216,900 380,200 Operating expenses 129,200 244,400 Net income $ 87,700 $ 135,800 5 Income Statement Reason for Decline in Net Income > [The following information applies to the questions displayed below.] Simon Company's year-end balance sheets follow. Current Yr 1 Yr Ago 2 Yrs Ago At December 31 Assets Cash Accounts receivable, net Merchandise inventory Prepaid expenses Plant assets, net Total assets Liabilities and Equity Accounts payable Long-term notes payable secured by mortgages on plant assets Common stock, $10 par value Retained earnings Total liabilities and equity $ 26,784 $ 31,308 $ 31,967 89, 200 62,700 50,700 110,000 83,000 54,000 8,625 8,218 3,552 214,863 202,250 179,481 $449, 472 $ 387,476 $ 319, 700 $113,038 $ 66,138 $ 42,622 85,346 162,500 88,588 $449, 472 90,011 71,360 162,500 162,500 68,827 43,218 $ 387,476 $ 319,700 The company's income statements for the Current Year and 1 Year Ago, follow. Assume that all sales are on credit: For Year Ended December 31 Sales Cost of goods sold Other operating expenses Interest expense Income tax expense Total costs and expenses Net income Earnings per share Current Yr $ 584,314 $ 356,432 181, 137 9,933 7,596 555,098 $ 29,216 $ 1.80 1 Yr Ago $ 461,096 $ 299,712 116,657 10,605 6,916 433, 890 $ 27,206 $ 1.67 (1-a) Compute days' sales uncollected. (1-b) For each ratio, determine if it improved or worsened in the current year


