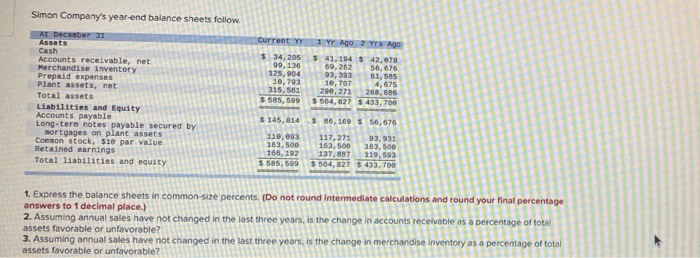
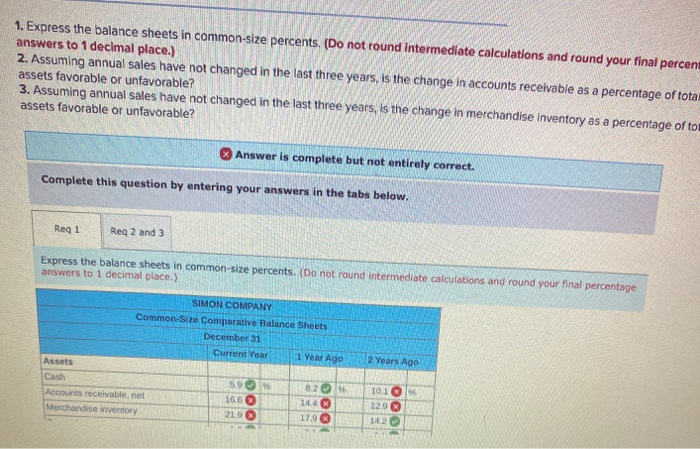
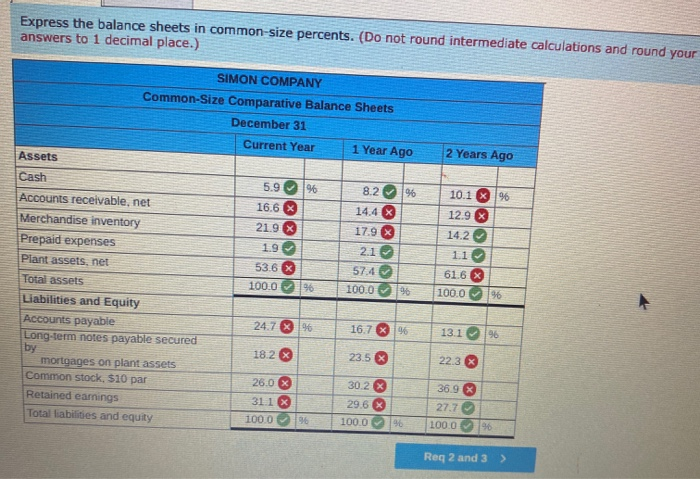
Simon Company's year-end balance sheets follow At December 31 Assets Cash Accounts receivable, net Merchandise inventory Prepaid expenses Plant assets, net Total assets Liabilities and Equity Accounts payable Long-tern notes payable secured by mortgages on plant assets Connon stock, $10 par value Retained earnings Total liabilities and equity current er $ 34, 205 99,136 125, 004 10, 793 315,561 $ 585,599 1 Yr Ago 2 yrs ago $ 41,194 $ 42,078 59,262 56,676 93,393 61,585 10,707 4,575 290, 271 268, 686 $504,827 $ 433,700 $ 86,169 $ 56, 676 $ 145,814 119,093 163,500 166, 192 $ 585,599 117,271 93,931 163,500 163,500 137, 887 119,593 $504,827 5433, 700 1. Express the balance sheets in common-size percents. (Do not round intermediate calculations and round your final percentage answers to 1 decimal place.) 2. Assuming annual sales have not changed in the last three years, is the change in accounts receivable as a percentage of total assets favorable or unfavorable? 3. Assuming annual sales have not changed in the last three years, is the change in merchandise Inventory as a percentage of total assets favorable or unfavorable? 1. Express the balance sheets in common-size percents. (Do not round intermediate calculations and round your final percent answers to 1 decimal place.) 2. Assuming annual sales have not changed in the last three years, is the change in accounts receivable as a percentage of tota assets favorable or unfavorable? 3. Assuming annual sales have not changed in the last three years, is the change in merchandise inventory as a percentage of to assets favorable or unfavorable? Answer is complete but not entirely correct. Complete this question by entering your answers in the tabs below. Reg 1 Reg 2 and 3 Express the balance sheets in common-size percents. (Do not round intermediate calculations and round your final percentage answers to 1 decimal place.) SIMON COMPANY Common-Size Comparative Balance Sheets December 31 Current Year 1 Year Ago Assets 2 Years Ago Cash Accounts receivable, net Merchandise inventory 59 16.6 219 8.2 10.4 179 1019 129 14.2 Express the balance sheets in common-size percents. (Do not round intermediate calculations and round your answers to 1 decimal place.) 2 Years Ago 10.1 %6 x x 12.9 14.2 SIMON COMPANY Common-Size Comparative Balance Sheets December 31 Current Year 1 Year Ago Assets Cash 5.9 96 8.2 %% Accounts receivable, net 16.6 14.4 X Merchandise inventory 21.9 17.9 X Prepaid expenses 1.9 2.1 Plant assets, net 53.6 X 57.4 Total assets 100.0 96 100.0 Liabilities and Equity Accounts payable 24.7 X 96 16.7 96 Long-term notes payable secured by 18.2 23.5 mortgages on plant assets Common stock, $10 par 26.0 X 30.2% Retained earnings 311 29.6 X Total liabilities and equity 100.0 96 100.0 96 XXI> XSIX 11 616 X 100.0 96 13.1 96 22.3 X 36.9 X 27.7 100.0 96 Req 2 and 3