Answered step by step
Verified Expert Solution
Question
1 Approved Answer
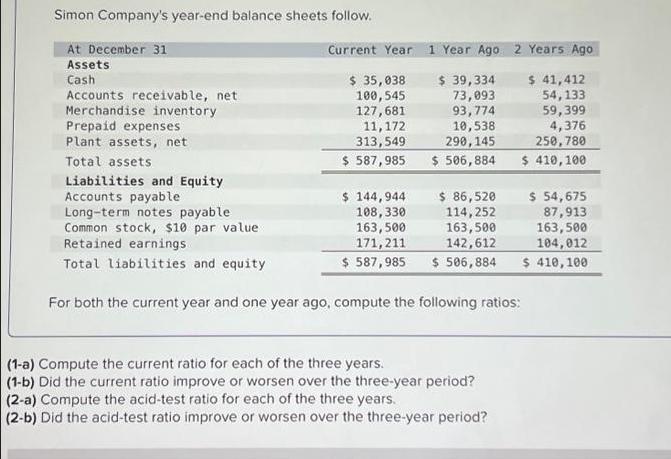
Simon Company's year-end balance sheets follow. At December 31 Assets Cash Accounts receivable, net Merchandise inventory Prepaid expenses Plant assets, net Total assets Liabilities

Simon Company's year-end balance sheets follow. At December 31 Assets Cash Accounts receivable, net Merchandise inventory Prepaid expenses Plant assets, net Total assets Liabilities and Equity Accounts payable Long-term notes payable Common stock, $10 par value Retained earnings Total liabilities and equity Current Year 1 Year Ago 2 Years Ago $ 39,334 $ 35,038 100,545 73,093 93,774 127,681 11, 172 313,549 10,538 290, 145 $ 587,985 $ 506,884 $ 144,944 108,330 163,500 171,211 $ 587,985 $ 86,520 114,252 163,500 142,612 $ 506,884 For both the current year and one year ago, compute the following ratios: (1-a) Compute the current ratio for each of the three years. (1-b) Did the current ratio improve or worsen over the three-year period? (2-a) Compute the acid-test ratio for each of the three years. (2-b) Did the acid-test ratio improve or worsen over the three-year period? $ 41,412 54,133 59,399 4,376 250,780 $ 410,100 $ 54,675 87,913 163,500 104,012 $ 410,100
Step by Step Solution
There are 3 Steps involved in it
Step: 1
Lets calculate the requested ratios for each year and then determine if they improved or worsened ov...
Get Instant Access to Expert-Tailored Solutions
See step-by-step solutions with expert insights and AI powered tools for academic success
Step: 2

Step: 3

Ace Your Homework with AI
Get the answers you need in no time with our AI-driven, step-by-step assistance
Get Started


