Answered step by step
Verified Expert Solution
Question
1 Approved Answer
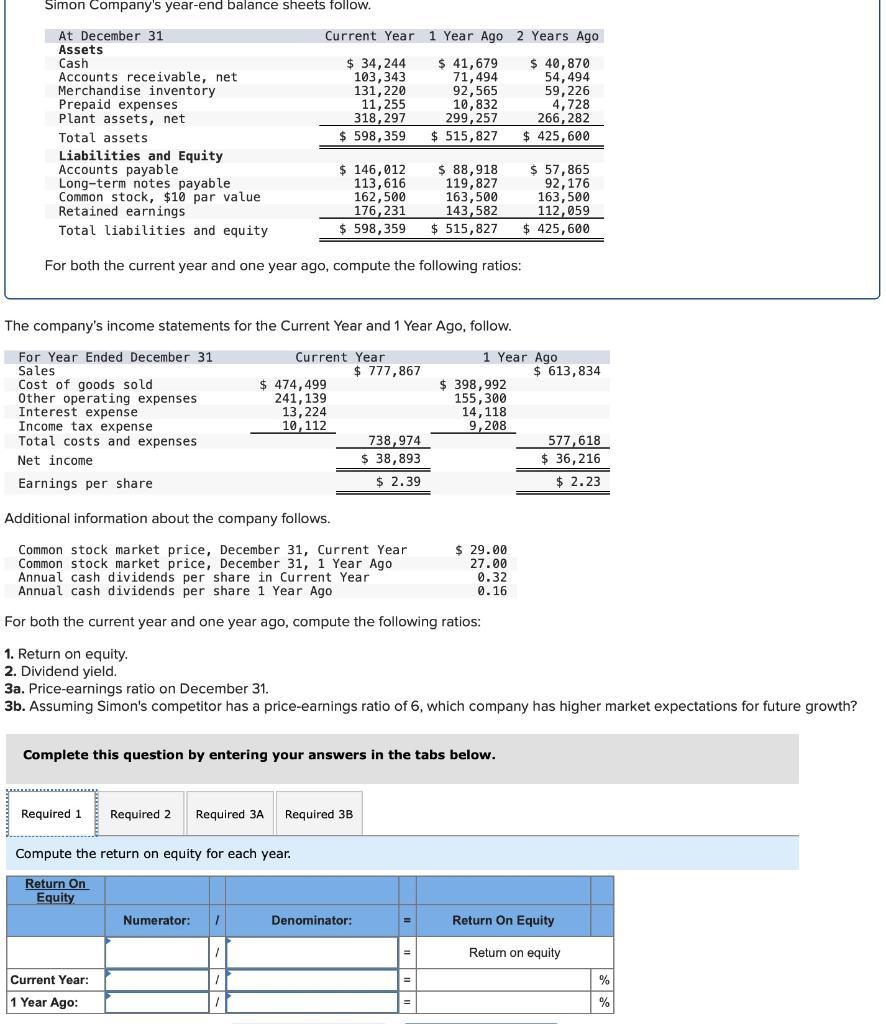
Simon Company's year-end balance sheets follow. At December 31 Assets Cash Accounts receivable, net Merchandise inventory Prepaid expenses Plant assets, net Total assets Liabilities

Simon Company's year-end balance sheets follow. At December 31 Assets Cash Accounts receivable, net Merchandise inventory Prepaid expenses Plant assets, net Total assets Liabilities and Equity Accounts payable Long-term notes payable Common stock, $10 par value Retained earnings Total liabilities and equity For both the current year and one year ago, compute the following ratios: Interest expense Income tax expense Total costs and expenses Net income Current Year 1 Year Ago 2 Years Ago $ 41,679 71,494 $ 34,244 103,343 131,220 11,255 318,297 92,565 10,832 299,257 $ 598,359 $ 515,827 Required 1 The company's income statements for the Current Year and 1 Year Ago, follow. Current Year 1 Year Ago For Year Ended December 31 Sales Cost of goods sold Other operating expenses $ 474,499 241,139 13,224 10,112 Current Year: 1 Year Ago: Compute the return on equity for each year. Return On Equity $ 146,012 113,616 162,500 176,231 $ 598,359 $515,827 $425,600 Numerator: Required 2 Required 3A Required 3B $ 777,867 738,974 $ 38,893 $ 2.39 Complete this question by entering your answers in the tabs below. Denominator: $ 88,918 119,827 163,500 143,582 Earnings per share Additional information about the company follows. Common stock market price, December 31, Current Year Common stock market price, December 31, 1 Year Ago Annual cash dividends per share in Current Year Annual cash dividends per share 1 Year Ago For both the current year and one year ago, compute the following ratios: 1. Return on equity. 2. Dividend yield. 3a. Price-earnings ratio on December 31. 3b. Assuming Simon's competitor has a price-earnings ratio of 6, which company has higher market expectations for future growth? = $ 398,992 155,300 = $ 40,870 54,494 59,226 4,728 266,282 $ 425,600 14,118 9,208 $ 29.00 27.00 0.32 0.16 $ 57,865 92,176 163,500 112,059 $ 613,834 577,618 $36,216 $2.23 Return On Equity Return on equity %
Step by Step Solution
★★★★★
3.43 Rating (162 Votes )
There are 3 Steps involved in it
Step: 1
To compute the return on equity ROE for each year we use the following formula Net Inco...
Get Instant Access to Expert-Tailored Solutions
See step-by-step solutions with expert insights and AI powered tools for academic success
Step: 2

Step: 3

Ace Your Homework with AI
Get the answers you need in no time with our AI-driven, step-by-step assistance
Get Started


