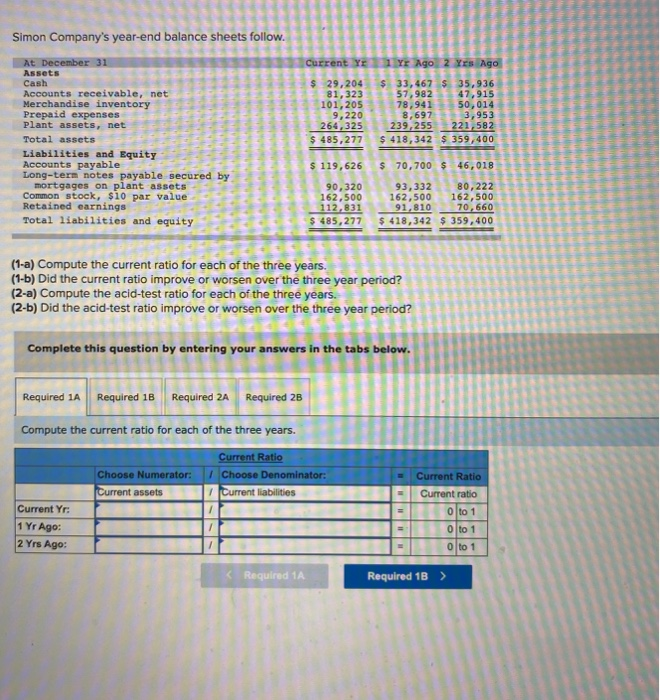
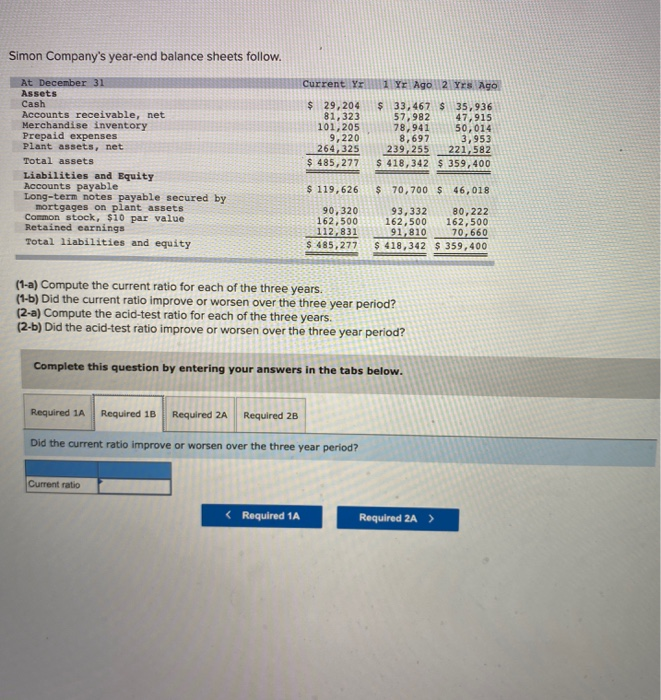
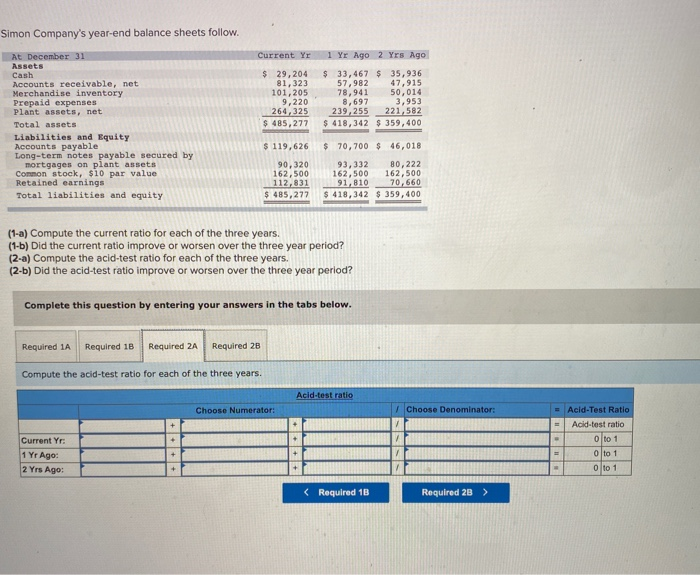
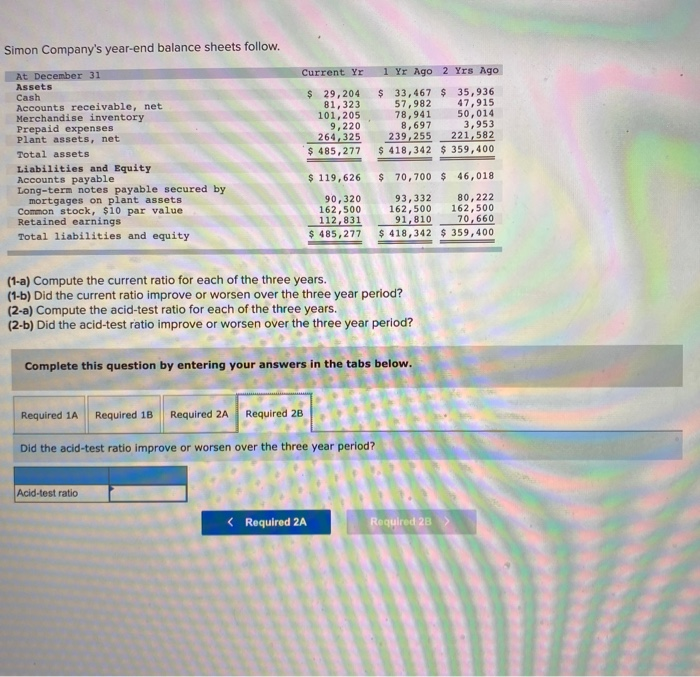
Simon Company's year-end balance sheets follow. Current Yr 1 Yr Ago 2 Yes Ago At December 31 Assets Cash Accounts receivable, net Merchandise inventory Prepaid expenses Plant assets, net Total assets Liabilities and Equity Accounts payable Long-term notes payable secured by mortgages on plant assets Common stock, $10 par value Retained earnings Total liabilities and equity $ 29,204 81,323 101,205 9,220 264,325 $ 485,277 $ 33, 467 $ 35,936 57,982 47,915 78,941 50,014 8,697 3,953 239,255 221,582 $ 418,342 $ 359,400 $ 119,626 $ 70,700 $ 46,018 90,320 162,500 112,831 $ 485,277 93, 332 80,222 162,500 162,500 91,810 70,660 $ 418,342 $ 359,400 (1-a) Compute the current ratio for each of the three years. (1-6) Did the current ratio improve or worsen over the three year period? (2-a) Compute the acid-test ratio for each of the three years. (2-b) Did the acid-test ratio improve or worsen over the three year period? Complete this question by entering your answers in the tabs below. Required 1A Required 1B Required 2A Required 28 Compute the current ratio for each of the three years. Choose Numerator: Current assets Current Ratio 1 Choose Denominator: Current liabilities Current Yr: 1 Yr Ago: 2 Yrs Ago: Current Ratio Current ratio O to 1 0 to 1 O to 1 = Simon Company's year-end balance sheets follow. Current Yr 1 Yr Ago 2 Yrs Ago At December 31 Assets Cash Accounts receivable, net Merchandise inventory Prepaid expenses Plant assets, net Total assets Liabilities and Equity Accounts payable Long-term notes payable secured by mortgages on plant assets Common stock, $10 par value Retained earnings Total liabilities and equity $ 29, 204 81,323 101,205 9,220 264,325 $ 485,277 $ 33,467 $ 35,936 57,982 47,915 78,941 50,014 8,697 3,953 239,255 221,582 $ 418,342 $ 359,400 $ 119,626 $ 70, 700 $ 46,018 90,320 162,500 112,831 $ 485,277 93,332 80,222 162,500 162,500 91,810 70,660 $ 418,342 $ 359,400 (1-a) Compute the current ratio for each of the three years. (1-1) Did the current ratio improve or worsen over the three year period? (2-a) Compute the acid-test ratio for each of the three years. (2-b) Did the acid-test ratio improve or worsen over the three year period? Complete this question by entering your answers in the tabs below. Required 1A Required 1B Required 2A Required 2B Did the current ratio improve or worsen over the three year period? Current ratio Simon Company's year-end balance sheets follow. Current Yr 1 Yr Ago 2 Yrs Ago At December 31 Assets Cash Accounts receivable, net Merchandise inventory Prepaid expenses Plant assets, net Total assets Liabilities and Equity Accounts payable Long-term notes payable secured by mortgages on plant assets Common stock, $10 par value Retained earnings Total liabilities and equity $ 29, 204 81,323 101,205 9,220 264,325 $ 485,277 $ 33,467 $ 35,936 57,982 47,915 78,941 50,014 8,697 3,953 239,255 221,582 $ 418,342 $ 359,400 $ 119,626 90,320 162,500 112,831 $ 485,277 $ 70, 700 $ 46,018 93,332 80,222 162,500 162,500 91,810 70,660 $ 418,342 $ 359,400 (1-a) Compute the current ratio for each of the three years. (1-b) Did the current ratio improve or worsen over the three year period? (2-a) Compute the acid-test ratio for each of the three years. (2-6) Did the acid-test ratio improve or worsen over the three year period? Complete this question by entering your answers in the tabs below. Required 1A Required 1B Required 2A Required 2B Compute the acid-test ratio for each of the three years. Acid-test ratio Choose Numerator: Choose Denominator: Current Yr: 1 Yr Ago: 2 Yrs Ago: Acid-Test Ratio Acid-test ratio 0 to 1 0 to 1 0 to 1 + Simon Company's year-end balance sheets follow. Current Yr $ 29, 204 81,323 101,205 9,220 264,325 $ 485,277 1 Yr Ago 2 Yrs Ago $ 33,467 $ 35,936 57,982 47,915 78,941 50,014 8,697 3,953 239, 255 221,582 $ 418,342 $ 359,400 At December 31 Assets Cash Accounts receivable, net Merchandise inventory Prepaid expenses Plant assets, net Total assets Liabilities and Equity Accounts payable Long-term notes payable secured by mortgages on plant assets Common stock, $10 par value Retained earnings Total liabilities and equity $ 119,626 $ 70,700 $ 46,018 90,320 162,500 112,831 $ 485,277 93, 332 80,222 162,500 162,500 91,810 70,660 $ 418,342 $ 359,400 (1-a) Compute the current ratio for each of the three years. (1-6) Did the current ratio improve or worsen over the three year period? (2-a) Compute the acid-test ratio for each of the three years. (2-b) Did the acid-test ratio improve or worsen over the three year period? Complete this question by entering your answers in the tabs below. Required 1A Required 1B Required 2A Required 2B Did the acid-test ratio improve or worsen over the three year period? Acid-test ratio
