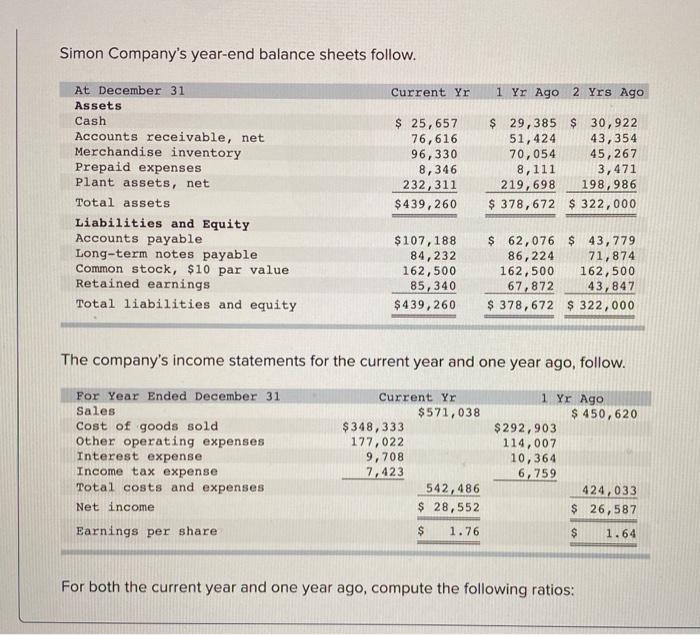
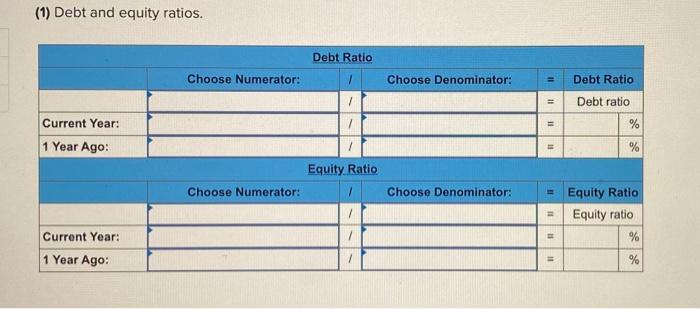
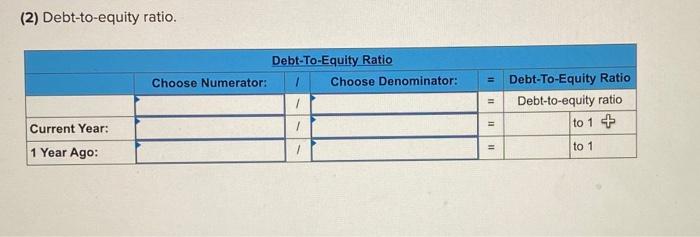
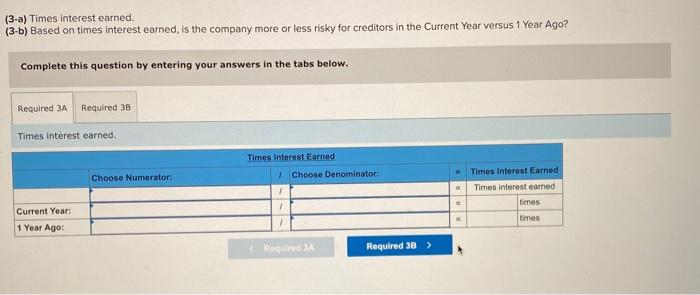
Simon Company's year-end balance sheets follow. Current Yr 1 Yr Ago 2 Yrs Ago At December 31 Assets Cash Accounts receivable, net Merchandise inventory Prepaid expenses Plant assets, net Total assets Liabilities and Equity Accounts payable Long-term notes payable Common stock, $10 par value Retained earnings Total liabilities and equity $ 25,657 76,616 96,330 8,346 232,311 $439,260 $ 29,385 $ 30,922 51,424 43,354 70,054 45,267 8,111 3,471 219,698 198,986 $ 378,672 $ 322,000 $107,188 84,232 162,500 85,340 $439, 260 $ 62,076 $ 43,779 86,224 71,874 162,500 162,500 67,872 43,847 $ 378,672 $ 322,000 The company's income statements for the current year and one year ago, follow. 1 Yr Ago $ 450, 620 For Year Ended December 31 Sales Cost of goods sold Other operating expenses Interest expense Income tax expense Total costs and expenses Net income Current Yr $571,038 $348,333 177,022 9,708 7,123 542,486 $ 28,552 $ 292,903 114,007 10,364 6,759 424,033 $ 26,587 Earnings per share $ 1.76 $ 1.64 For both the current year and one year ago, compute the following ratios: (1) Debt and equity ratios. Debt Ratio Choose Numerator: 7 Choose Denominator: Debt Ratio Debt ratio Current Year: % 1 Year Ago: % Equity Ratio Choose Numerator: Choose Denominator: Equity Ratio Equity ratio % Current Year: 1 Year Ago: 11 % (2) Debt-to-equity ratio. Debt-To-Equity Ratio Choose Numerator: Choose Denominator: = Debt-To-Equity Ratio Debt-to-equity ratio to 14 to 1 11 Current Year: 1 Year Ago: 11 (3-a) Times interest earned. (3-b) Based on times interest earned, is the company more or less risky for creditors in the Current Year versus 1 Year Ago? Complete this question by entering your answers in the tabs below. Required 3A Required 3B Times interest earned. Times Interest Earned Choose Numerator Choose Denominator: Times Interest Earned Times interest earned 1 1 times Current Year: 1 Year Ago: 1 times
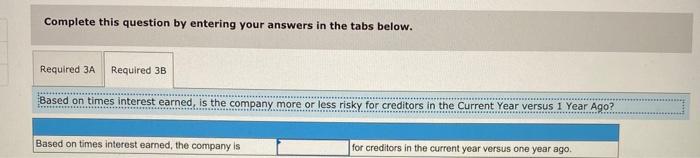
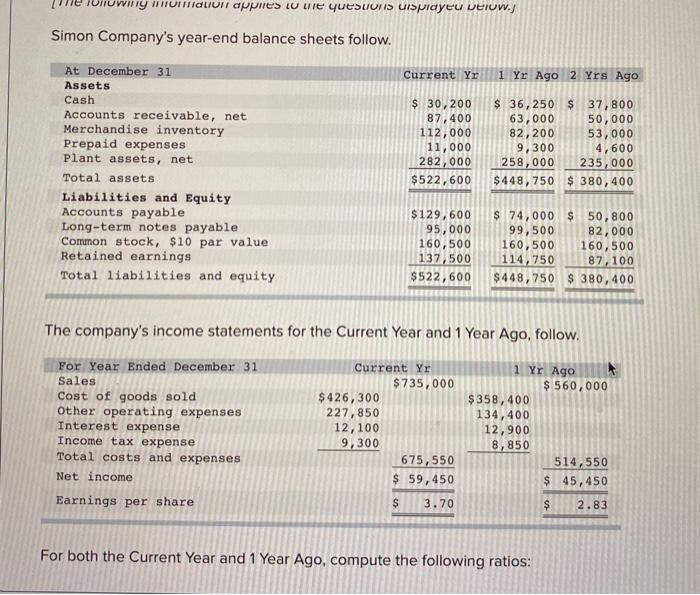
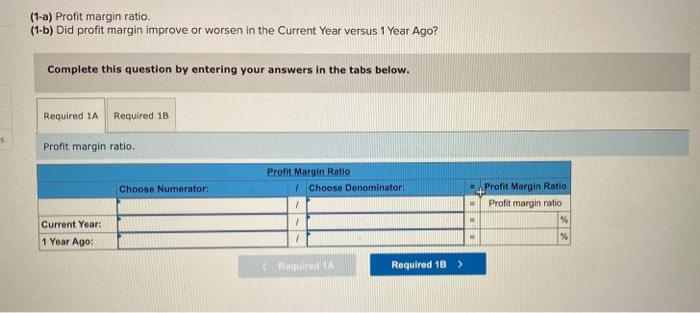
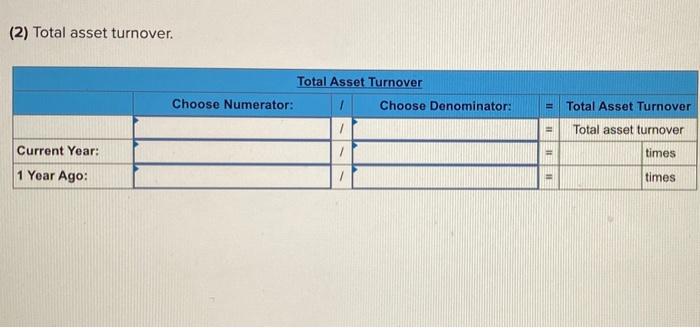
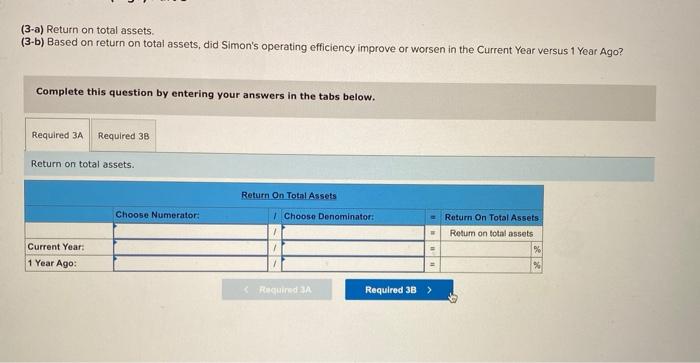
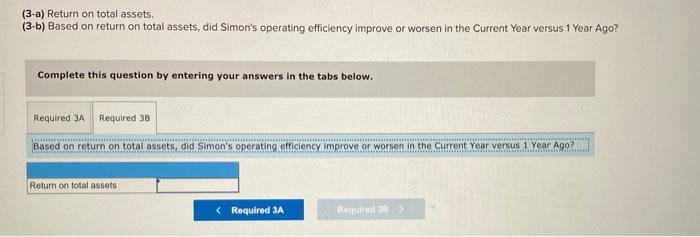
Complete this question by entering your answers in the tabs below. Required 3A Required 3B Based on times interest earned, is the company more or less risky for creditors in the Current Year versus 1 Year Ago? Based on times interest earned, the company is for creditors in the current year versus one year ago willy londoni applies LU LTE Yesunis Uisplayeu velow.) Simon Company's year-end balance sheets follow. Current Yu 1 Yr Ago 2 Yrs Ago At December 31 Assets Cash Accounts receivable, net Merchandise inventory Prepaid expenses Plant assets, net Total assets Liabilities and Equity Accounts payable Long-term notes payable Common stock, $10 par value Retained earnings Total liabilities and equity $ 30,200 87,400 112,000 11,000 282,000 $522,600 $ 36,250 $ 37,800 63,000 50,000 82,200 53,000 9,300 4,600 258,000 235,000 $448,750 $ 380,400 $129,600 95,000 160,500 137,500 $522,600 $ 74,000 $ 50,800 99,500 82,000 160,500 160,500 114,750 87,100 $448,750 $ 380,400 The company's income statements for the Current Year and 1 Year Ago, follow. 1 Yr Ago $ 560,000 For Year Ended December 31 Sales Cost of goods sold Other operating expenses Interest expense Income tax expense Total costs and expenses Net income Earnings per share Current Yr $735,000 $426,300 227,850 12,100 9,300 675,550 $ 59,450 $358,400 134,400 12,900 8,850 514,550 $ 45,450 $ 3.70 $ 2.83 For both the Current Year and 1 Year Ago, compute the following ratios: (1-a) Profit margin ratio. (1-b) Did profit margin improve or worsen in the Current Year versus 1 Year Ago? Complete this question by entering your answers in the tabs below. Required 1A Required 18 5 Profit margin ratio. Profit Margin Ratio Choose Denominator: Choose Numerator: Profit Margin Ratio Profit margin ratio % % 1 Current Year: 1 Year Ago: Required 1A Required 1B > (1-a) Profit margin ratio. (1-b) Did profit margin improve or worsen in the Current Year versus 1 Year Ago? Complete this question by entering your answers in the tabs below. Required 1A Required 18 Did profit margin improve or worsen in the Current Year versus 1 Year Ago? Profit margin (2) Total asset turnover. Total Asset Turnover Choose Numerator: Choose Denominator: TI Total Asset Turnover Total asset turnover Current Year: times 1 Year Ago: - times (3-a) Return on total assets. (3-b) Based on return on total assets, did Simon's operating efficiency improve or worsen in the Current Year versus 1 Year Ago? Complete this question by entering your answers in the tabs below. Required 3A Required 38 Return on total assets. Return On Total Assets Choose Numerator: Choose Denominator: Return On Total Assets Rotum on total assets 1 Current Year: 1 Year Ago: 1 Required a Required 3B > (3-a) Return on total assets, (3-b) Based on return on total assets, did Simon's operating efficiency improve or worsen in the Current Year versus 1 Year Ago? Complete this question by entering your answers in the tabs below. Required 3A Required 38 Based on return on total assets, did Simon's operating efficiency improve or worsen in the current Year versus 1 Year Ago? Return on total assets