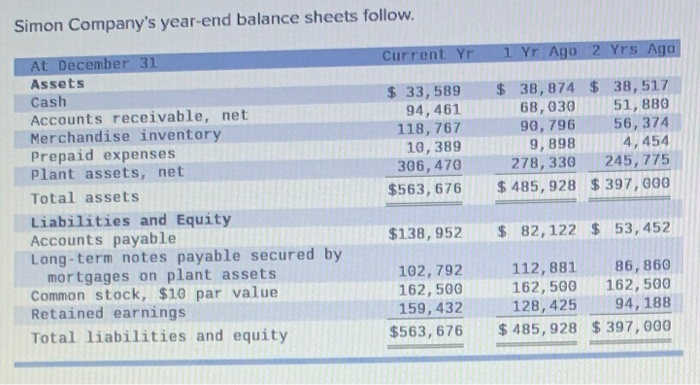
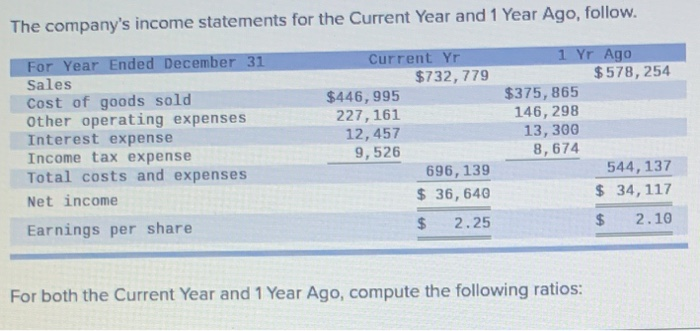
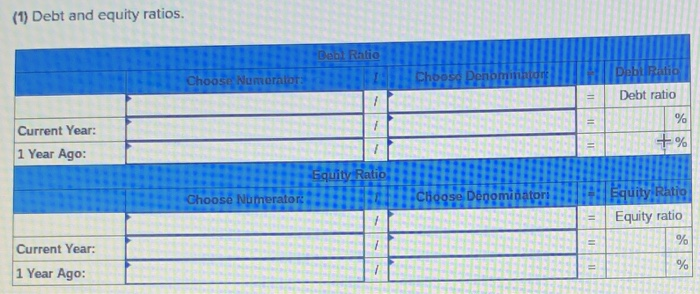
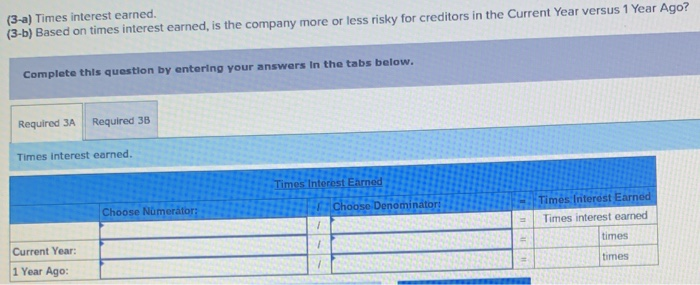
Simon Company's year-end balance sheets follow. Current yr 1 Yr Ago 2 Yrs Ago At December 31 Assets Cash Accounts receivable, net Merchandise inventory Prepaid expenses plant assets, net Total assets Liabilities and Equity Accounts payable Long-term notes payable secured by mortgages on plant assets Common stock, $10 par value Retained earnings Total liabilities and equity $ 33,589 94.461 118,767 10,389 306,470 $563, 676 $ 38,874 $ 38,517 68, 030 51, 880 90, 796 56, 374 9, 898 4,454 278, 330 245, 775 $ 485,928 $ 397,000 $138,952 $ 82,122 $ 53,452 162,500 159, 432 $563, 676 112,881 162,500 128, 425 $ 485,928 86,860 162,500 94,188 $ 397,000 The company's income statements for the Current Year and 1 Year Ago, follow. For Year Ended December 31 Sales Cost of goods sold Other operating expenses Interest expense Income tax expense Total costs and expenses Net income Earnings per share Current Yr $732,779 $446,995 227,161 12,457 9,526 696,139 $ 36,640 $ 2.25 1 Yr Ago $578, 254 $375, 865 146,298 13, 300 8,674 544,137 $ 34, 117 $ 2.10 For both the Current Year and 1 Year Ago, compute the following ratios: (1) Debt and equity ratios. Bob Ratio Choose Denminhd Ratio Debt ratio Current Year: 1 Year i + % 91 le O Equity Ratio Equity ratio 11 Current 1 Year Ago: (2) Debt-to-equity ratio. Debl-To-Equity Ratio Choose Numerator: Choose Denominator: Debt-To-Equity Ratio Debt-to-equity ratio to 1 Current Year: 1 Year Ago: = = = 1 I (3-a) Times interest earned. (3-b) Based on times interest earned, is the company more or less risky for creditors in the Current Year versus 1 Year Ago? Complete this question by entering your answers in the tabs below. Required 3A Required 38 Times interest earned. Times Interest Earned Choose Denominator Choose Numerator: Times Interest Earned Times interest earned i times Current Year: 1 Year Ago: times