

Question
Simon has taken to increase their liquidity. Do an analysis on how these steps benefit liquidity and comment on the impact on all financial statements.
Simon has taken to increase their liquidity. Do an analysis on how these steps benefit liquidity and comment on the impact on all financial statements. For this exercise, assume Simon will have a decrease in revenue of up to 50% for this upcoming quarter and 75% for the quarter after that. What does the future look like?
for balence sheet
| Assets | Q3 2019 | Q4 2019 | Q1 2020 | |||
| Q2 2019 | 8/31/19 | 11/30/19 | 2/29/20 | |||
| 5/31/19 | ||||||
| Cash and Short Term Invs | 1,202 | 1,153 | 518 | 1,354 | ||
| Total Receivables, Net | 615 | 588 | 598 | 405 | ||
| Total Inventory | 501 | 482 | 427 | 440 | ||
| Prepaid Expenses | 498 | 468 | 472 | 687 | ||
| Restricted Cash - Current | -- | -- | 13 | -- | ||
| Other Current Assets | 19 | 21 | 31 | -1 | ||
| Other Curr. Assets, Total | 19 | 21 | 44 | -1 | ||
| Total Current Assets | 2,835 | 2,712 | 2,059 | 2,885 | ||
| Prop./Plant/Equip. - Net | 36,814 | 36,466 | 38,131 | 39,492 | ||
| Goodwill, Net | 2,907 | 2,886 | 2,912 | 2,176 | ||
| Intangibles - Net | 1,172 | 1,166 | 1,174 | 1,173 | ||
| Other Long Term Assets | 784 | 771 | 782 | 1,217 | ||
| Total Assets | 44,512 | 44,001 | 45,058 | 46,943 | ||
| Liabilities | Q3 2019 | Q4 2019 | Q1 2020 | |||
| Q2 2019 | 8/31/19 | 11/30/19 | 2/29/20 | |||
| 5/31/19 | ||||||
| Accounts Payable | 792 | 695 | 756 | 904 | ||
| Accrued Expenses | 1,665 | 1,706 | 1,801 | 1,922 | ||
| Notes Payable/ST Debt | 480 | 238 | 231 | 1,004 | ||
| Curr. Port. LT Dbt/Cap Ls. | 1,614 | 1,607 | 1,596 | 2,196 | ||
| Customer Advances | 5,815 | 4,674 | 4,735 | 4,690 | ||
| Other Current Liabilities | 11 | 12 | 8 | -- | ||
| Other Curr. Lblts, Total | 5,826 | 4,686 | 4,743 | 4,690 | ||
| Total Current Liabilities | 10,377 | 8,932 | 9,127 | 10,716 | ||
| Total Long Term Debt | 9,080 | 8,893 | 9,675 | 9,738 | ||
| Total Debt | 11,174 | 10,738 | 11,502 | 12,938 | ||
| Other Liabilities, Total | 947 | 881 | 891 | 2,199 | ||
| Total Liabilities | 20,404 | 18,706 | 19,693 | 22,653 | ||
| Shareholder | Q3 2019 | Q4 2019 | Q1 2020 | |||
| Equity | Q2 2019 | 8/31/19 | 11/30/19 | 2/29/20 | ||
| 5/31/19 | ||||||
| Common Stock | 365 | 365 | 365 | 366 | ||
| Additional Paid-In Capital | 8,785 | 8,798 | 8,807 | 8,829 | ||
| Ret. Earn.(Accum. Deficit) | 25,138 | 26,576 | 26,653 | 25,527 | ||
| Treasury Stock - Common | -8,104 | -8,261 | -8,394 | -8,404 | ||
| Other Equity, Total | -2,076 | -2,183 | -2,066 | -2,028 | ||
| Total Equity | 24,108 | 25,295 | 25,365 | 24,290 | ||
| Total Liabilities & Shareholders Equity | 44,512 | 44,001 | 45,058 | 46,943 | ||
| Shr Outs.-Com. Primary Iss. | 527 | 527 | 527 | 528 | ||
| Shr Outs.-Com. Stk. Iss. 2 | 163 | 160 | 157 | 157 | ||
| Ttl Comm. Shares Outs. | 690 | 687 | 684 | 685 | ||
| Trsy. Shrs-Comm. Primary Iss. | 130 | 130 | 130 | 130 | ||
| Trsy. Shrs-Comm. Iss. 2 | 54 | 57 | 60 | 60 |
|
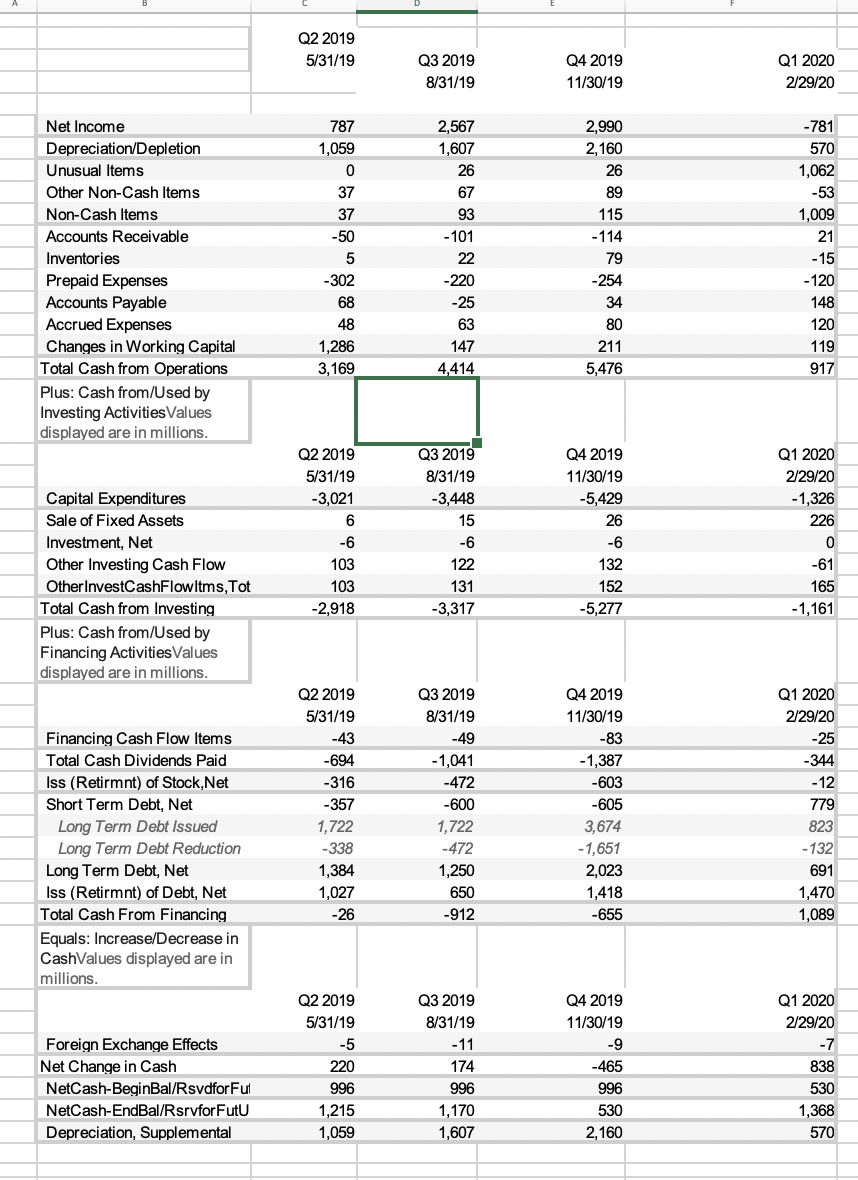
and cash flow
Step by Step Solution
There are 3 Steps involved in it
Step: 1

Get Instant Access to Expert-Tailored Solutions
See step-by-step solutions with expert insights and AI powered tools for academic success
Step: 2

Step: 3
Ace Your Homework with AI
Get the answers you need in no time with our AI-driven, step-by-step assistance
Get Started
Low Income Housing Tax Credit IRS Audit Techniques Guide
Authors: Internal Revenue Service
1st Edition
978-1304135087