

Answered step by step
Verified Expert Solution
Question
1 Approved Answer
Simulation can be used to illustrate a number of results from statistics that are difficule to understand with nonsimulation arguments. One is the famous central
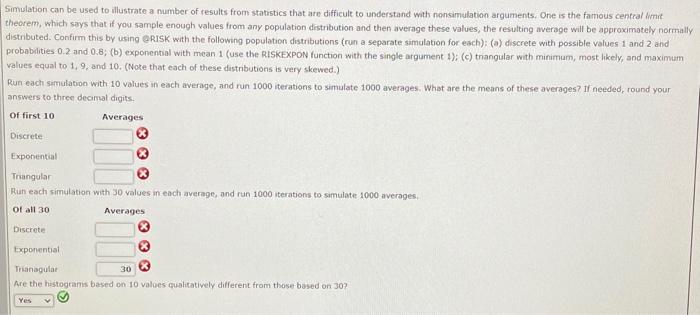
 Simulation can be used to illustrate a number of results from statistics that are difficule to understand with nonsimulation arguments. One is the famous central limit theorem, which says that if you sample enough values from any population distribution and then average these values, the resulting average will be approximately normally distributed. Confirm this by using eRISK with the following population distributions (run a separate simulation for each): (a) discrete with possible values 1 and 2 and probabalies 0.2 and 0.8 ; (b) exponental with mean 1 (use the RISKEXPON function with the single argument 1 ); (c) triangular with minimum, most likely, and maximum values equal to 1,9 , and 10 . (Note that each of these distnbutions is very skewed.) Run each simulation with 10 values in each average, and run 1000 iterations to simulate 1000 averages, What are the means of these averages? if needed, round your answers to three decinal digits. Run each simulation with 30 values in each average, and run 1000 iterations to simulate 1000 averages. Are the histograms based on 10 valoes quahtatively different from those based on 30 ? Please provide steps and answers
Step by Step Solution
There are 3 Steps involved in it
Step: 1

Get Instant Access to Expert-Tailored Solutions
See step-by-step solutions with expert insights and AI powered tools for academic success
Step: 2

Step: 3
Ace Your Homework with AI
Get the answers you need in no time with our AI-driven, step-by-step assistance
Get Started
The Financial Diet A Total Beginners Guide To Getting Good With Money
Authors: Chelsea Fagan, Lauren Ver Hage
1st Edition
1250176166, 978-1250176165