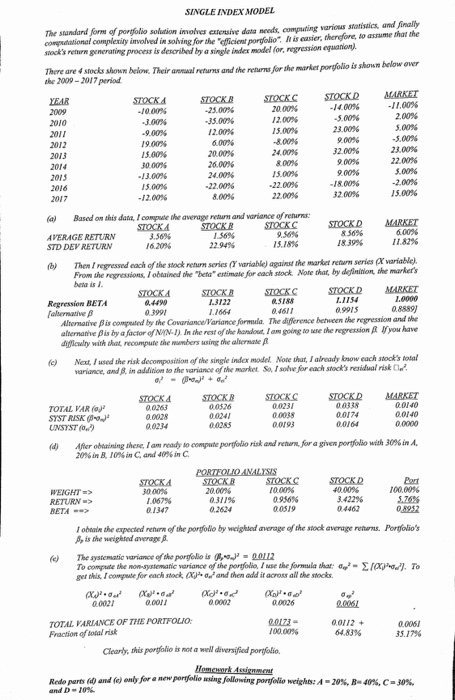
SINGLE INDEX MODEL souation imolves extensive data needs, computng various statisics, and Jinally in solving for the eficient portolio I is easier, therefore, so assume that the The standard forns of portfolio sock's return generating process is described by a single inde e 2009-2017 period YEAR model (or, regression equanion). There are 4 stocks shown below. Their ual retarns and the retuns for the market porfolio is shoum below ovenr STOCKASTOCKC STOCKD MARKET 2009 10.00% "3.00% 9.00% 19.00% 15.00% 30.00% -25.00% 12.00% 20.00 -11.00% 2.00% 5.00% 20. 00% 12.00% 1 5.00% -800% 24,00% 00% .1400% -5.00% 2012 2013 -5.00% 00% 32.00% 9. 0096 22.00% 5.00% -2.00% 15.0% 2013 15.00% -12.00% -22.00% -22.00% 22.00% -18.00% 3200% a) Based on this data, Icompule the average retaurs and variance of returs STOCKD 856% 18 39% MARKET 1 1.82% variable) AVERAGE RETURN STD DEV RETURN 3.56% 16.20% 22.94% 15.18% b Then I regressed each of the stock return series ( variable) against the market retaurn series (ar the market retarn series From the regressions, I obuined the "beta"estimate for each stook Note chat, by deflxintion, the marker's beta is STOCKB 1.3122 STOCKD MARKET Regression BETA 05188 04611 0.9915 Alternanive Bis compeated by the afternatve pis by a factor of NYN-l) In she et of difficulty with that, recompute formula. The difference between the regression and the going to ue the rsnyou have hem mbers usin: the alternate ? e) Nat Iused the risk decomposition of the single index modet Note shat, Ialready tnow each stock's toa uriance, andt in addition bo the sariance of the morket S I sotve for each stocok's rualrisk TOTAL VAR (0)2 SYST RISK 00526 00241 00285 STOCKD MARKET G04o 00140 00231 00038 00174 00164 00234 0or93 Afer obtainingshe e lam ready soco pute por lio risk and ret 20%inB, 10%n C, and 40%in C. (d) for a given port lio with 30%inA. 3000% 1.067% 01347 STOCKB 20.00% 0.311% 10.00% 40.00% 3.422% 04462 100.00% I obtain the expected return of the porpolio by weighsed average of the stock average retarns. Portolio's ?, is the weighted average (e) The systematic variance of the porgolio is012 To compute the non systematic variance of lhe por folio use the formula that: a-/-? [?-o23. To get this. I computefor each stock, (X ad, and then add it cross all the stocks. 00021 0.00 0.0026 0.06 TOTAL VARIANCE OF THE PORTFOLIO Fraction of cotal risk 00173 100.00% 00112 0.006 35.17% 64,83% Clearly, this porfolio is not ? well diversified portfolio. Redo parts (d) and (c) e ly for a new portfolio using following portfolio weights: A-20%, B-40%, c-30% SINGLE INDEX MODEL souation imolves extensive data needs, computng various statisics, and Jinally in solving for the eficient portolio I is easier, therefore, so assume that the The standard forns of portfolio sock's return generating process is described by a single inde e 2009-2017 period YEAR model (or, regression equanion). There are 4 stocks shown below. Their ual retarns and the retuns for the market porfolio is shoum below ovenr STOCKASTOCKC STOCKD MARKET 2009 10.00% "3.00% 9.00% 19.00% 15.00% 30.00% -25.00% 12.00% 20.00 -11.00% 2.00% 5.00% 20. 00% 12.00% 1 5.00% -800% 24,00% 00% .1400% -5.00% 2012 2013 -5.00% 00% 32.00% 9. 0096 22.00% 5.00% -2.00% 15.0% 2013 15.00% -12.00% -22.00% -22.00% 22.00% -18.00% 3200% a) Based on this data, Icompule the average retaurs and variance of returs STOCKD 856% 18 39% MARKET 1 1.82% variable) AVERAGE RETURN STD DEV RETURN 3.56% 16.20% 22.94% 15.18% b Then I regressed each of the stock return series ( variable) against the market retaurn series (ar the market retarn series From the regressions, I obuined the "beta"estimate for each stook Note chat, by deflxintion, the marker's beta is STOCKB 1.3122 STOCKD MARKET Regression BETA 05188 04611 0.9915 Alternanive Bis compeated by the afternatve pis by a factor of NYN-l) In she et of difficulty with that, recompute formula. The difference between the regression and the going to ue the rsnyou have hem mbers usin: the alternate ? e) Nat Iused the risk decomposition of the single index modet Note shat, Ialready tnow each stock's toa uriance, andt in addition bo the sariance of the morket S I sotve for each stocok's rualrisk TOTAL VAR (0)2 SYST RISK 00526 00241 00285 STOCKD MARKET G04o 00140 00231 00038 00174 00164 00234 0or93 Afer obtainingshe e lam ready soco pute por lio risk and ret 20%inB, 10%n C, and 40%in C. (d) for a given port lio with 30%inA. 3000% 1.067% 01347 STOCKB 20.00% 0.311% 10.00% 40.00% 3.422% 04462 100.00% I obtain the expected return of the porpolio by weighsed average of the stock average retarns. Portolio's ?, is the weighted average (e) The systematic variance of the porgolio is012 To compute the non systematic variance of lhe por folio use the formula that: a-/-? [?-o23. To get this. I computefor each stock, (X ad, and then add it cross all the stocks. 00021 0.00 0.0026 0.06 TOTAL VARIANCE OF THE PORTFOLIO Fraction of cotal risk 00173 100.00% 00112 0.006 35.17% 64,83% Clearly, this porfolio is not ? well diversified portfolio. Redo parts (d) and (c) e ly for a new portfolio using following portfolio weights: A-20%, B-40%, c-30%