

Answered step by step
Verified Expert Solution
Question
1 Approved Answer
sir need asap please help me please need asap expert please 11. In this problem you will use the spreadsheet SPEMINI_Dec21_PriceOlVol.xlsx, a file containing data
sir need asap please help me please need asap expert please
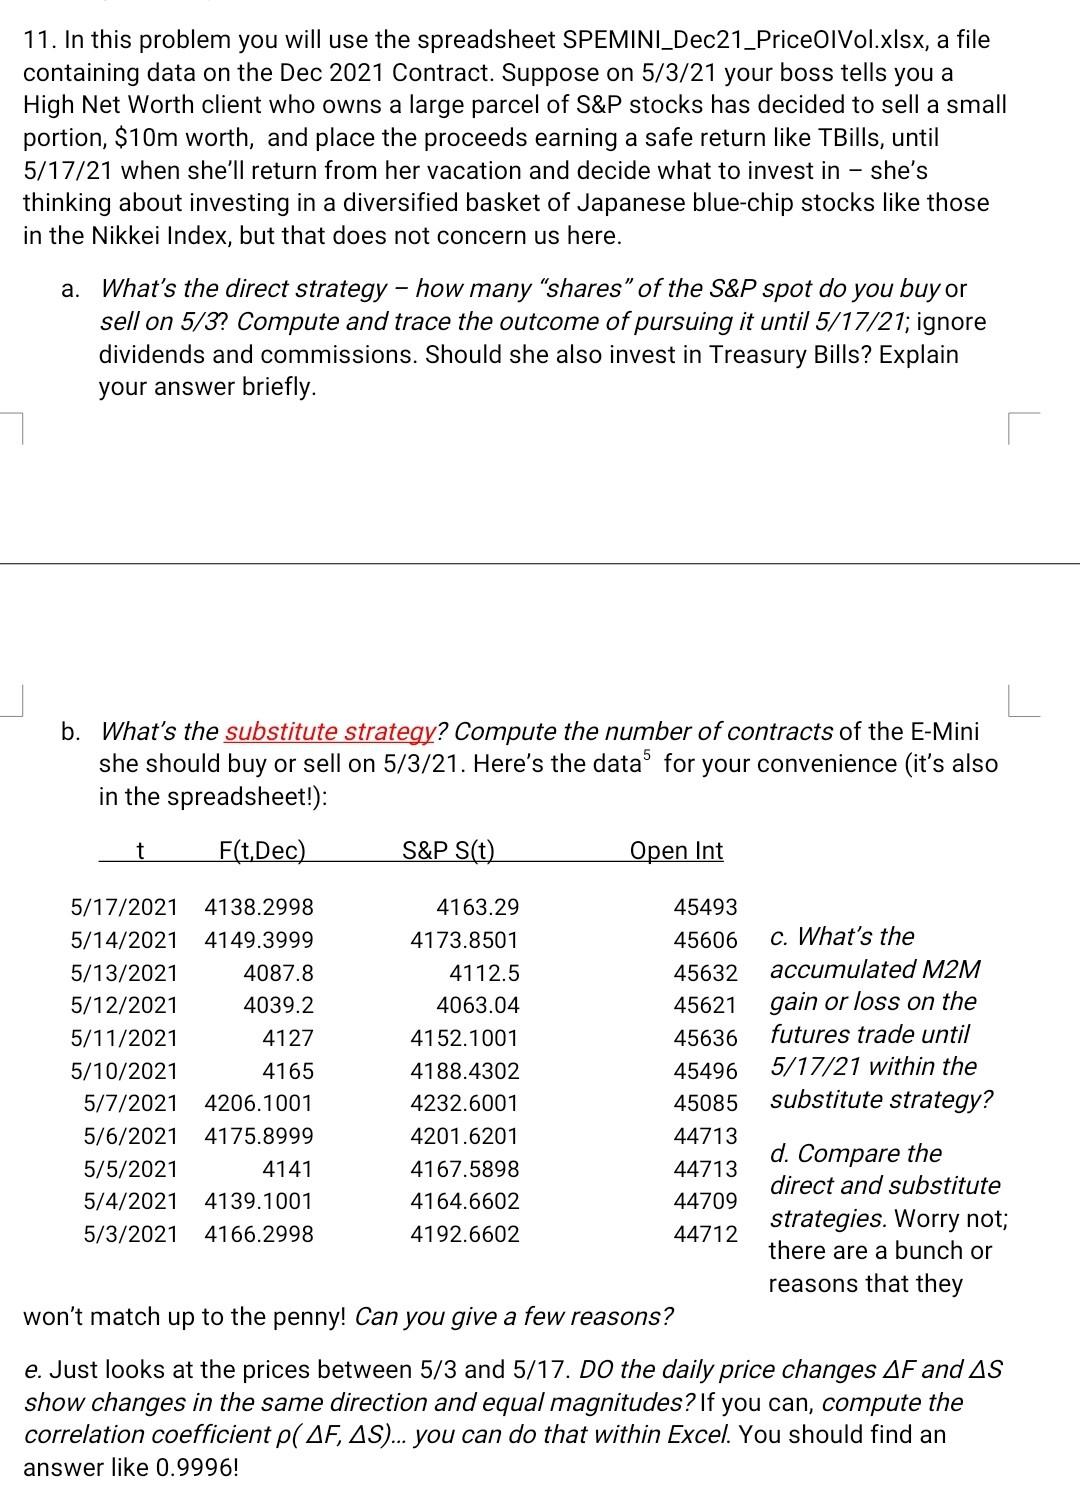
11. In this problem you will use the spreadsheet SPEMINI_Dec21_PriceOlVol.xlsx, a file containing data on the Dec 2021 Contract. Suppose on 5/3/21 your boss tells you a High Net Worth client who owns a large parcel of S&P stocks has decided to sell a small portion, $10m worth, and place the proceeds earning a safe return like TBills, until 5/17/21 when she'll return from her vacation and decide what to invest in she's thinking about investing in a diversified basket of Japanese blue-chip stocks like those in the Nikkei Index, but that does not concern us here. a. What's the direct strategy how many shares of the S&P spot do you buy or sell on 5/3? Compute and trace the outcome of pursuing it until 5/17/21; ignore dividends and commissions. Should she also invest in Treasury Bills? Explain your answer briefly. b. What's the substitute strategy? Compute the number of contracts of the E-Mini she should buy or sell on 5/3/21. Here's the data for your convenience (it's also in the spreadsheet!): t F(t,Dec) S&P S(t) Open Int 5/17/2021 5/14/2021 5/13/2021 5/12/2021 5/11/2021 5/10/2021 5/7/2021 5/6/2021 5/5/2021 5/4/2021 5/3/2021 4138.2998 4149.3999 4087.8 4039.2 4127 4165 4206.1001 4175.8999 4141 4139.1001 4166.2998 4163.29 4173.8501 4112.5 4063.04 4152.1001 4188.4302 4232.6001 4201.6201 4167.5898 4164.6602 4192.6602 45493 45606 45632 45621 45636 45496 45085 44713 44713 44709 44712 c. What's the accumulated M2M gain or loss on the futures trade until 5/17/21 within the substitute strategy? d. Compare the direct and substitute strategies. Worry not; there are a bunch or reasons that they won't match up to the penny! Can you give a few reasons? e. Just looks at the prices between 5/3 and 5/17. DO the daily price changes AF and AS show changes in the same direction and equal magnitudes? If you can, compute the correlation coefficient p( AF, AS)... you can do that within Excel. You should find an answer like 0.9996! 11. In this problem you will use the spreadsheet SPEMINI_Dec21_PriceOlVol.xlsx, a file containing data on the Dec 2021 Contract. Suppose on 5/3/21 your boss tells you a High Net Worth client who owns a large parcel of S&P stocks has decided to sell a small portion, $10m worth, and place the proceeds earning a safe return like TBills, until 5/17/21 when she'll return from her vacation and decide what to invest in she's thinking about investing in a diversified basket of Japanese blue-chip stocks like those in the Nikkei Index, but that does not concern us here. a. What's the direct strategy how many shares of the S&P spot do you buy or sell on 5/3? Compute and trace the outcome of pursuing it until 5/17/21; ignore dividends and commissions. Should she also invest in Treasury Bills? Explain your answer briefly. b. What's the substitute strategy? Compute the number of contracts of the E-Mini she should buy or sell on 5/3/21. Here's the data for your convenience (it's also in the spreadsheet!): t F(t,Dec) S&P S(t) Open Int 5/17/2021 5/14/2021 5/13/2021 5/12/2021 5/11/2021 5/10/2021 5/7/2021 5/6/2021 5/5/2021 5/4/2021 5/3/2021 4138.2998 4149.3999 4087.8 4039.2 4127 4165 4206.1001 4175.8999 4141 4139.1001 4166.2998 4163.29 4173.8501 4112.5 4063.04 4152.1001 4188.4302 4232.6001 4201.6201 4167.5898 4164.6602 4192.6602 45493 45606 45632 45621 45636 45496 45085 44713 44713 44709 44712 c. What's the accumulated M2M gain or loss on the futures trade until 5/17/21 within the substitute strategy? d. Compare the direct and substitute strategies. Worry not; there are a bunch or reasons that they won't match up to the penny! Can you give a few reasons? e. Just looks at the prices between 5/3 and 5/17. DO the daily price changes AF and AS show changes in the same direction and equal magnitudes? If you can, compute the correlation coefficient p( AF, AS)... you can do that within Excel. You should find an answer like 0.9996Step by Step Solution
There are 3 Steps involved in it
Step: 1

Get Instant Access to Expert-Tailored Solutions
See step-by-step solutions with expert insights and AI powered tools for academic success
Step: 2

Step: 3
Ace Your Homework with AI
Get the answers you need in no time with our AI-driven, step-by-step assistance
Get Started
Financial Informatics An Information Based Approach To Asset Pricing
Authors: Dorje C Brody, Lane Palmer Hughston, Andrea Macrina
1st Edition
9811246483, 978-9811246487