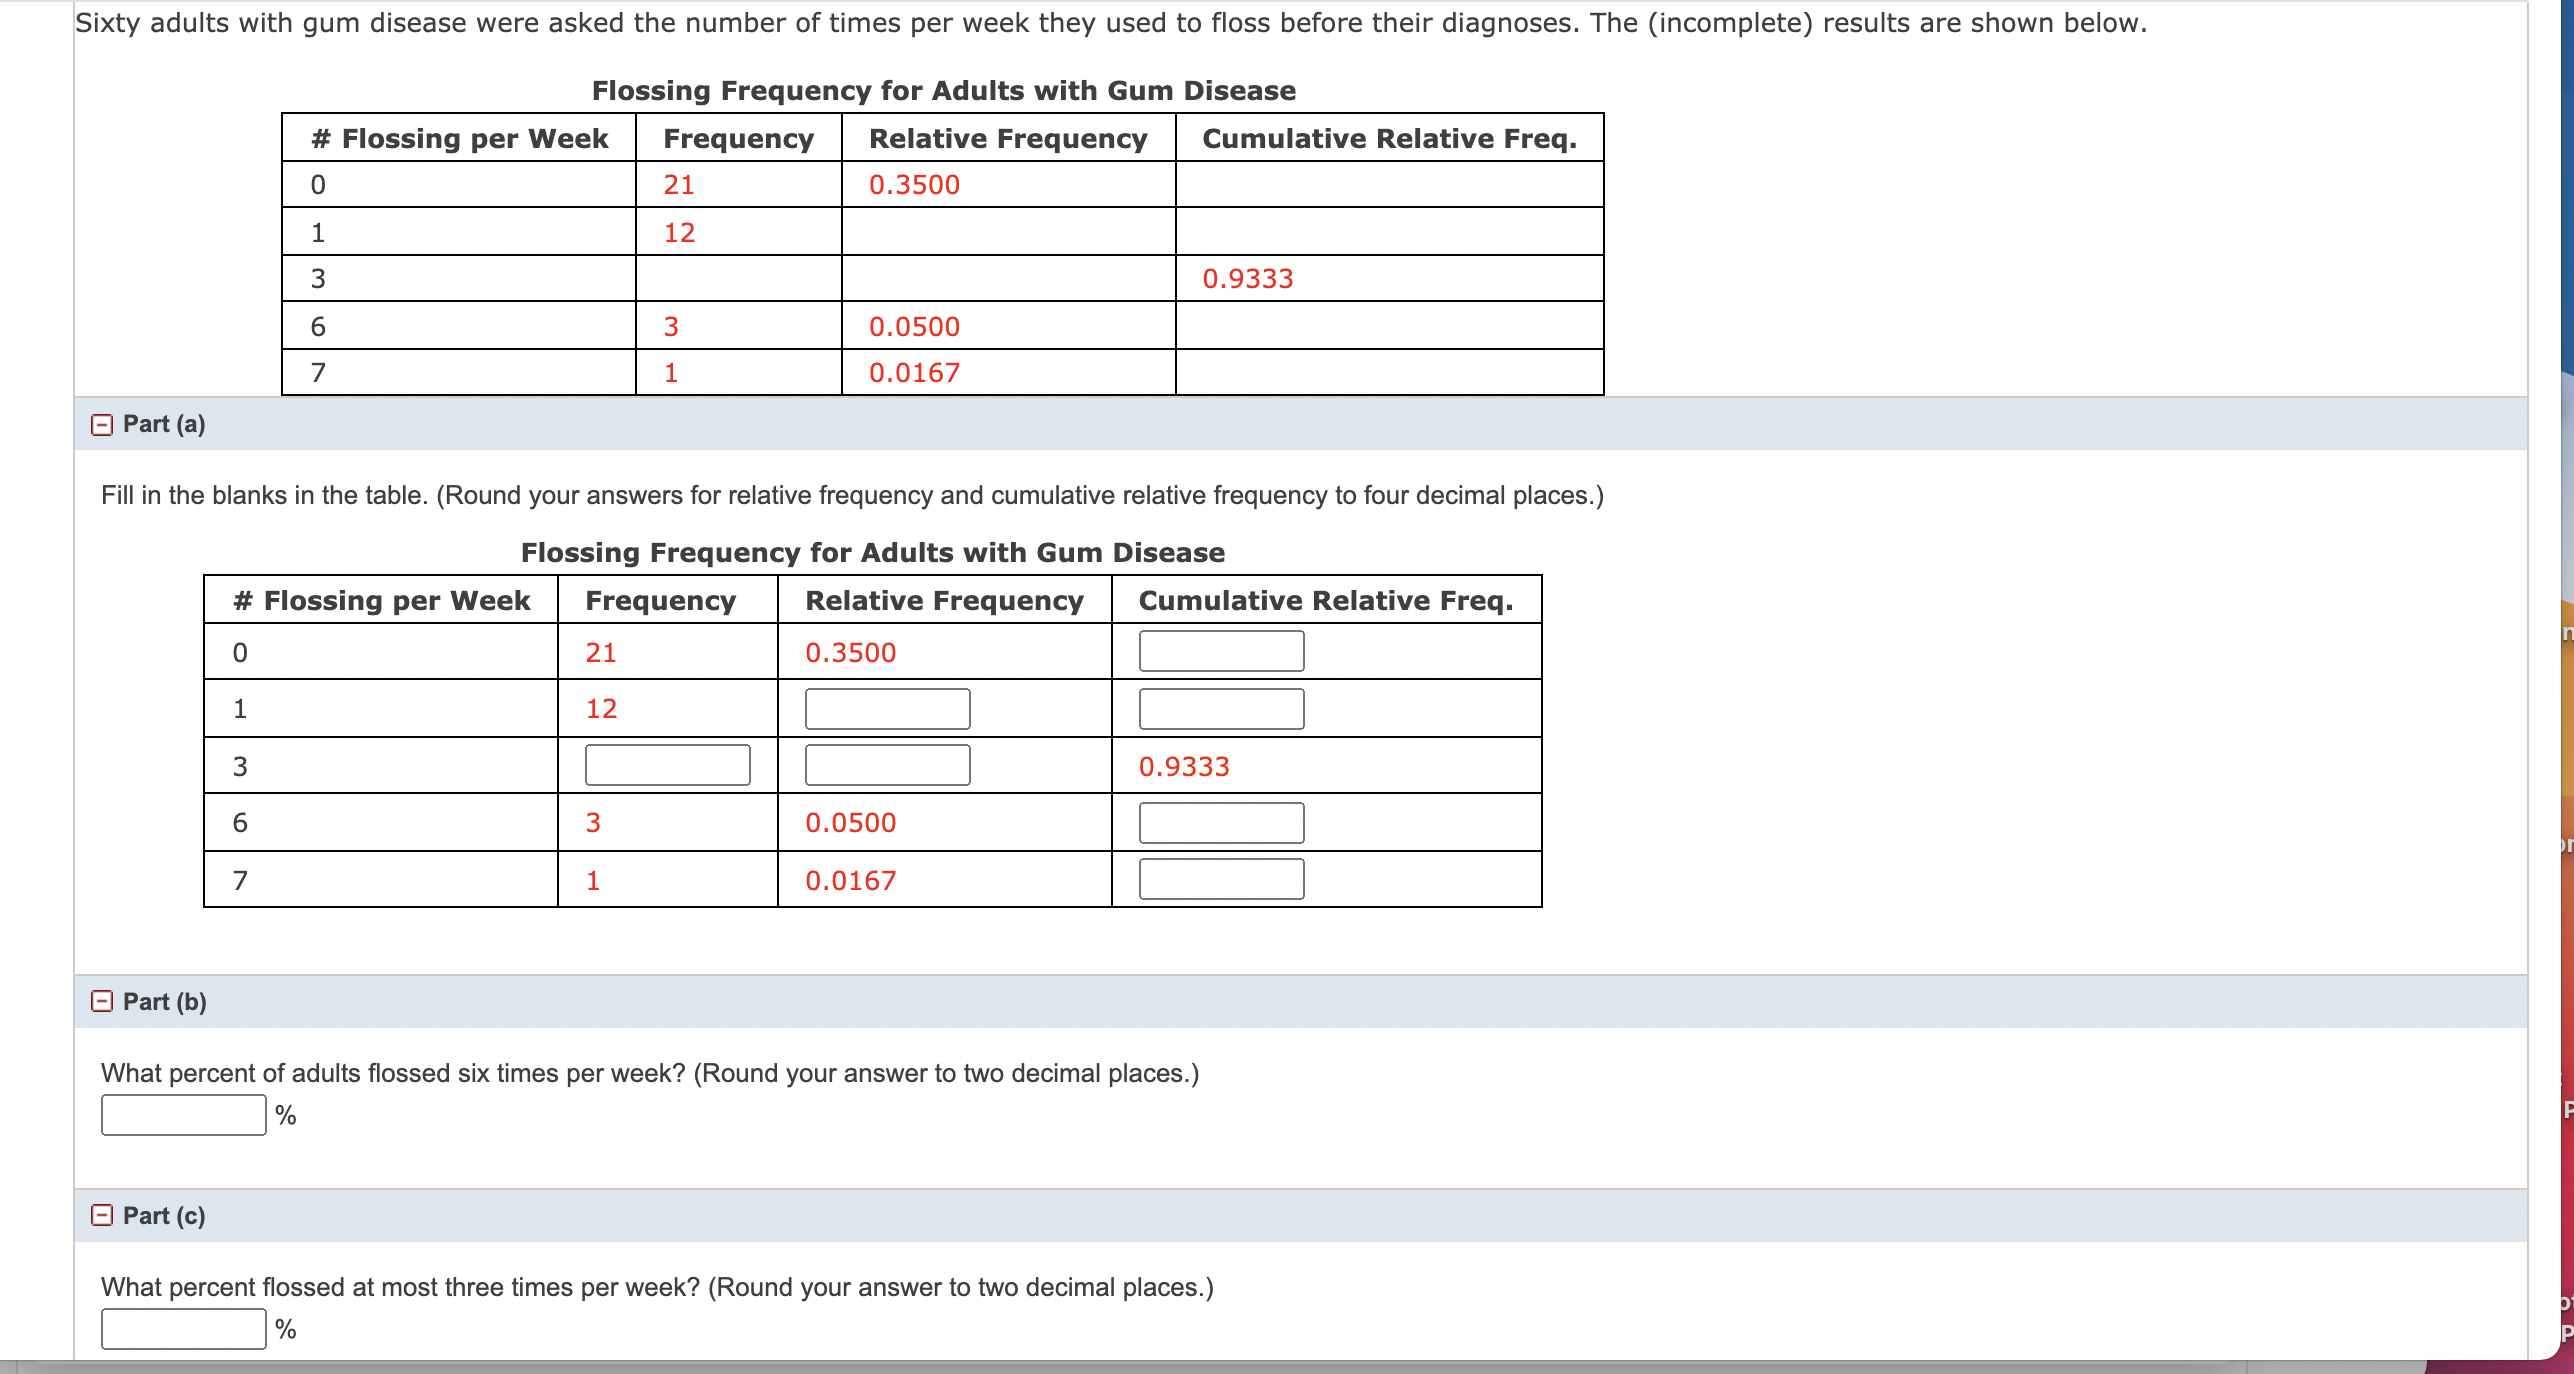
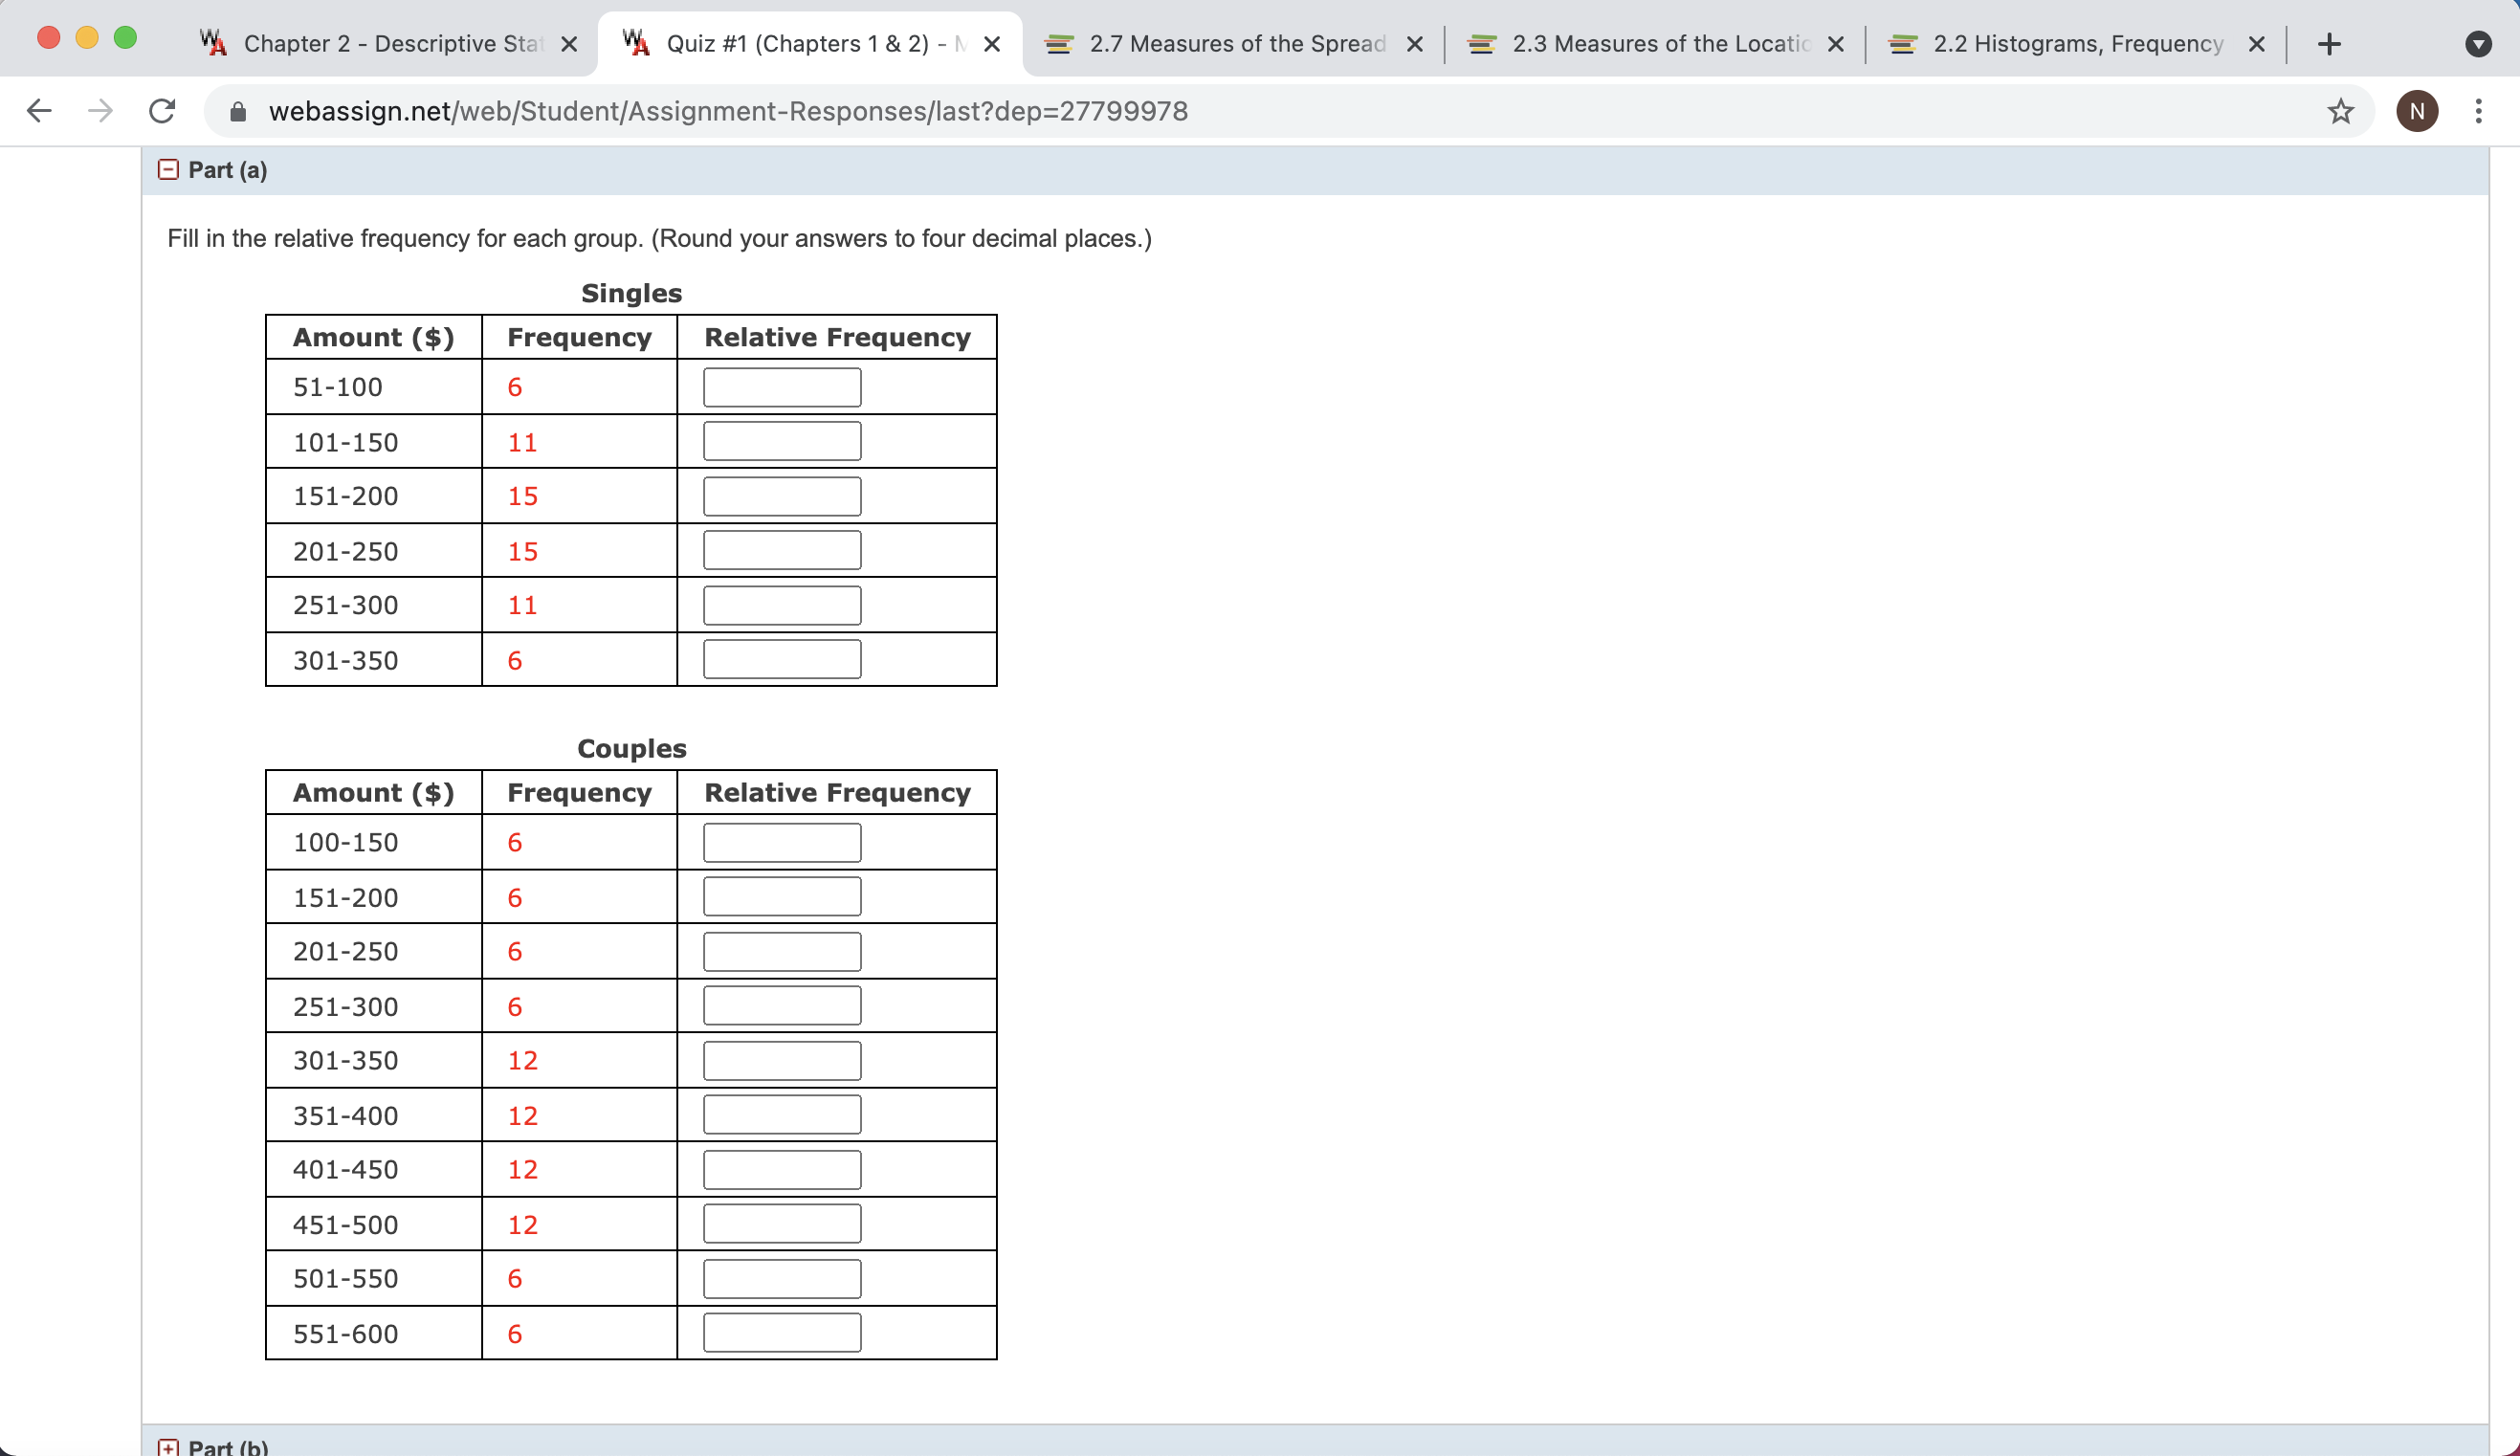
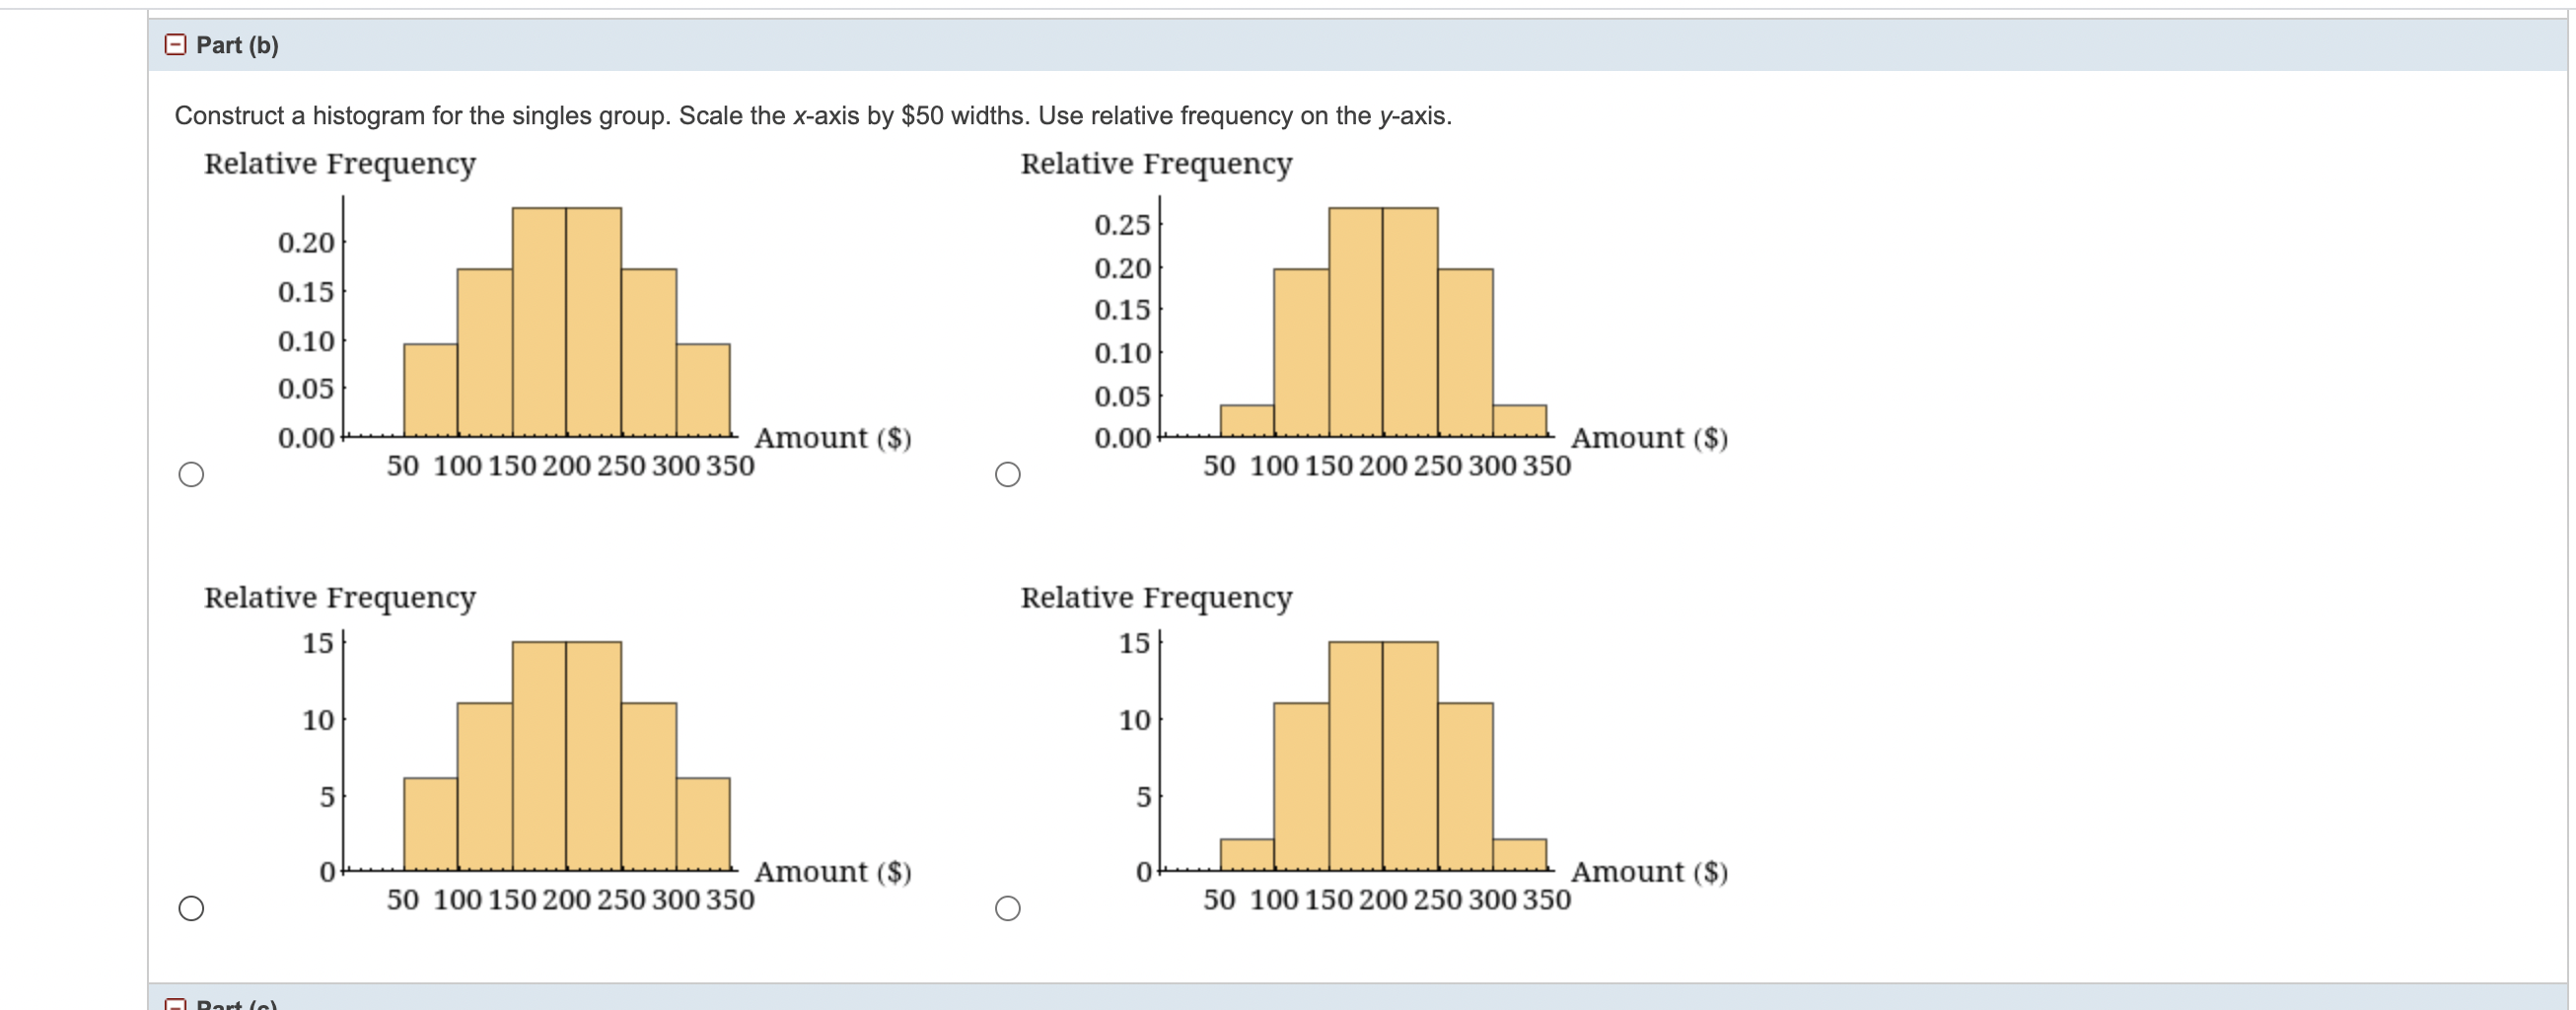
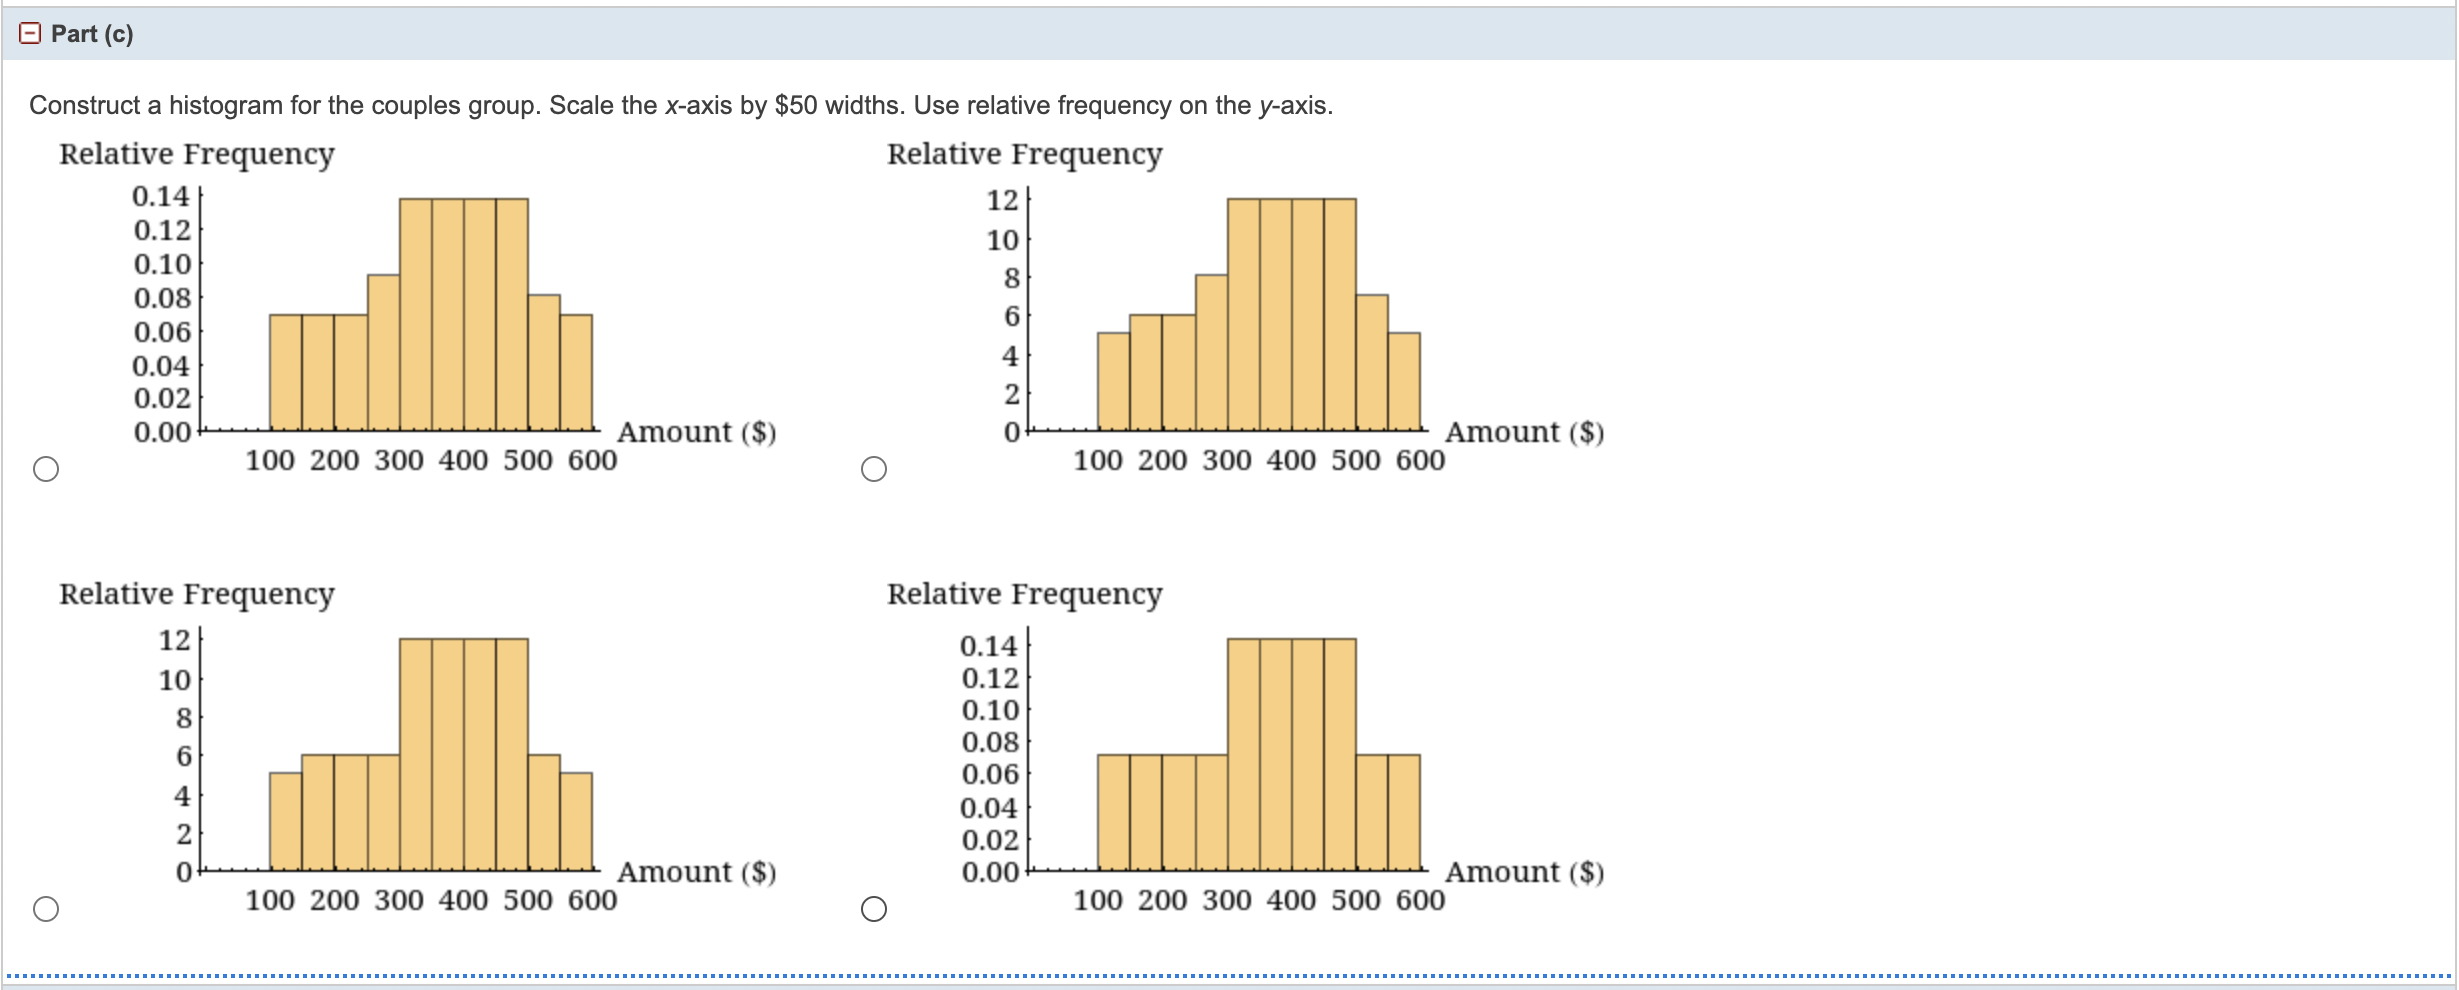
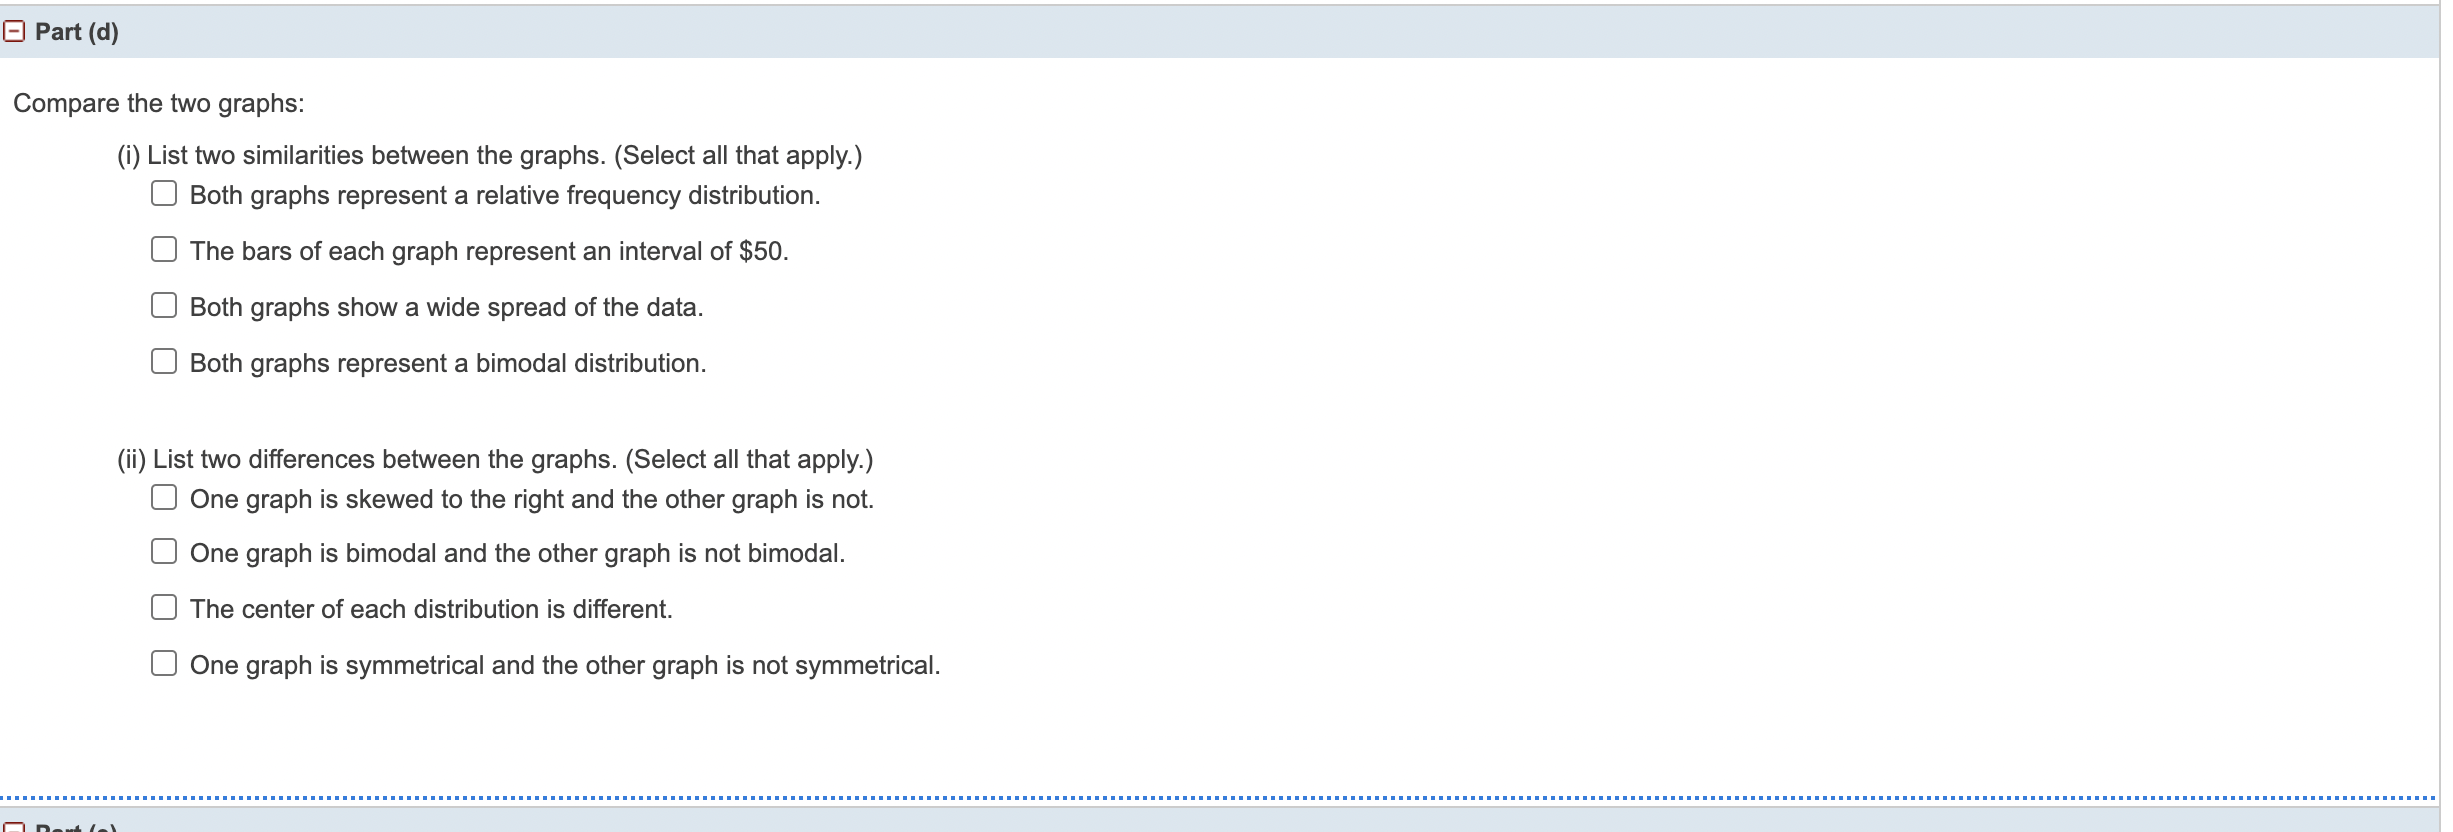
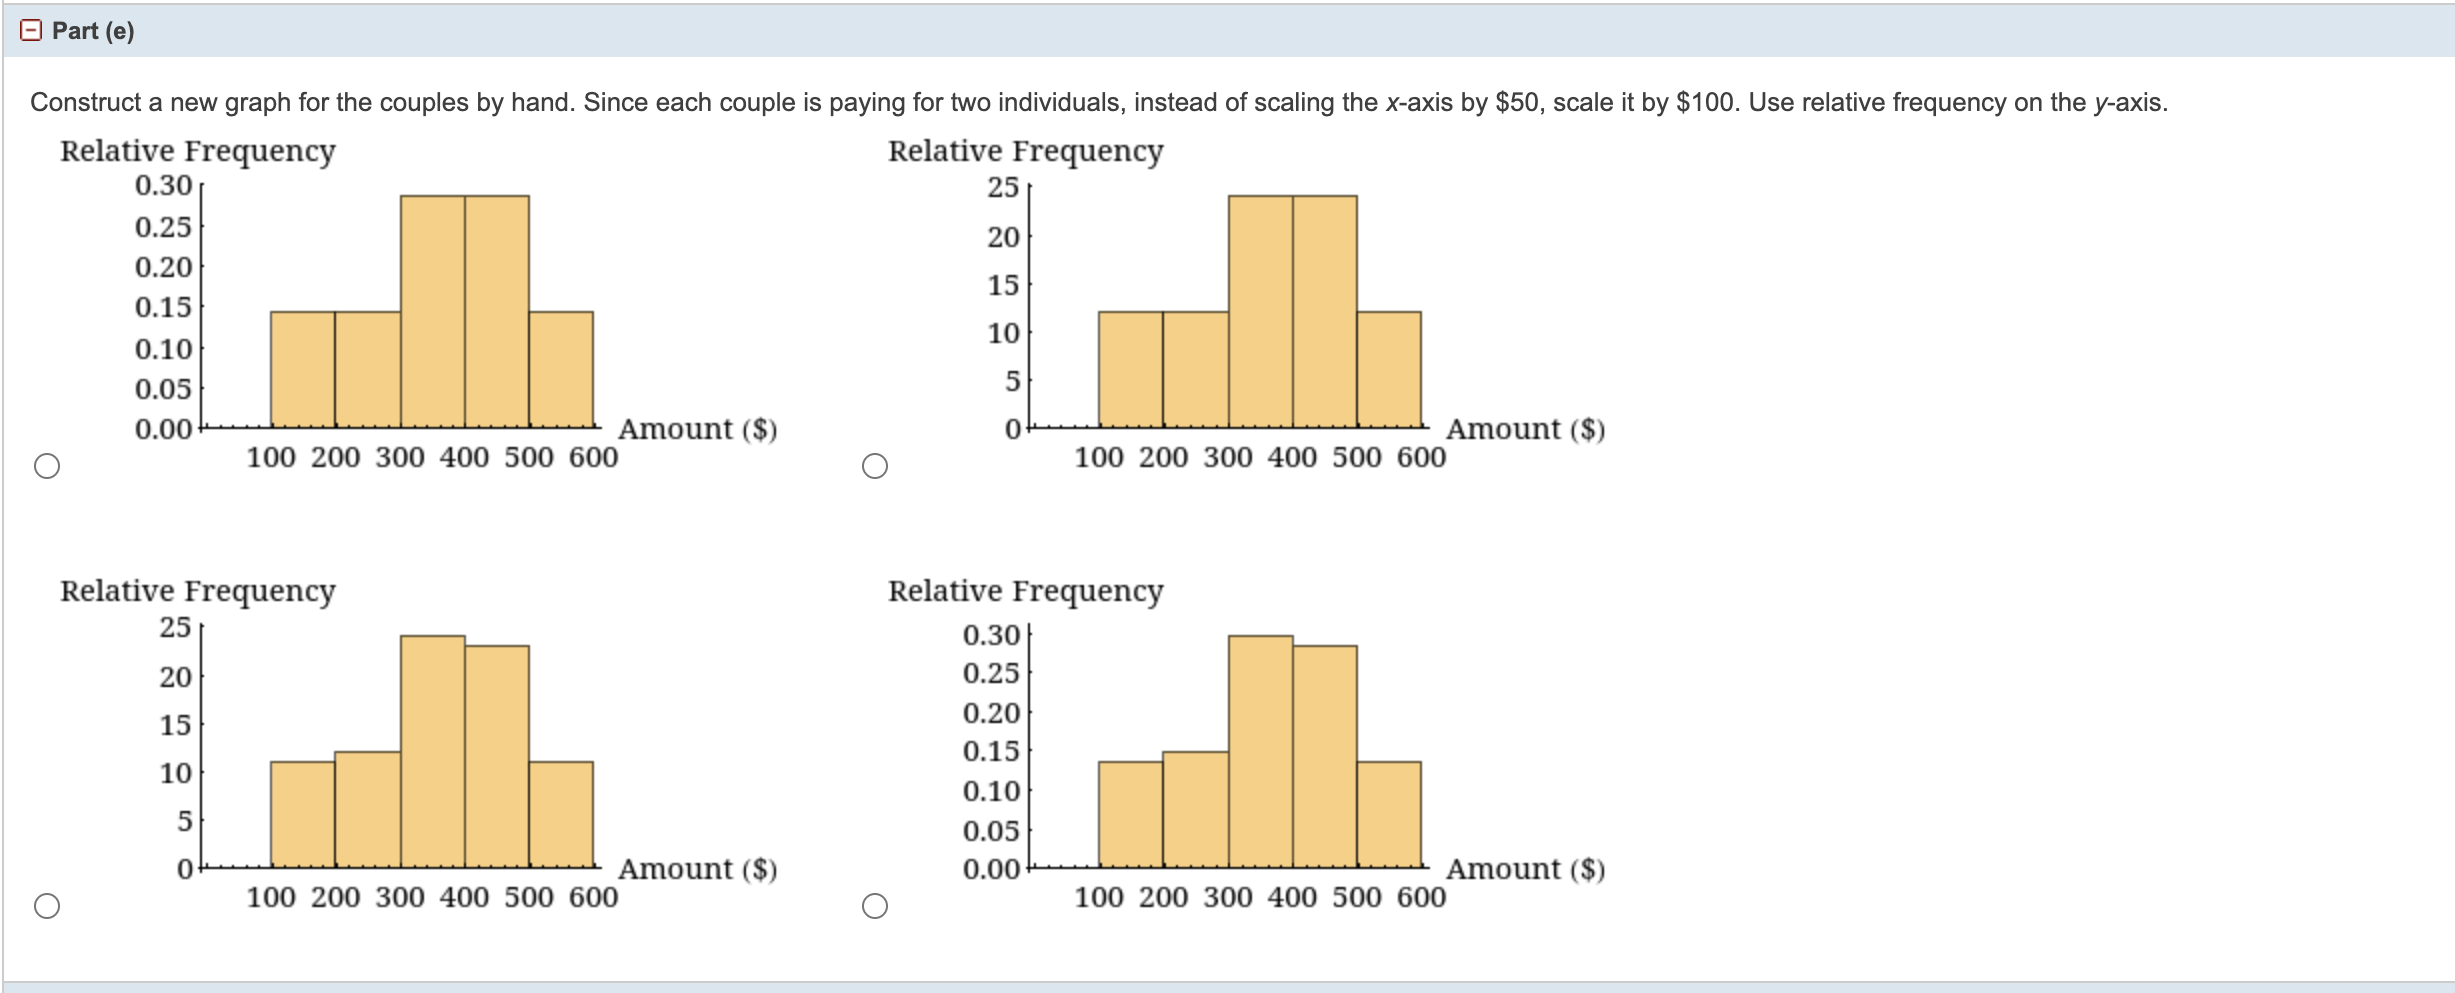
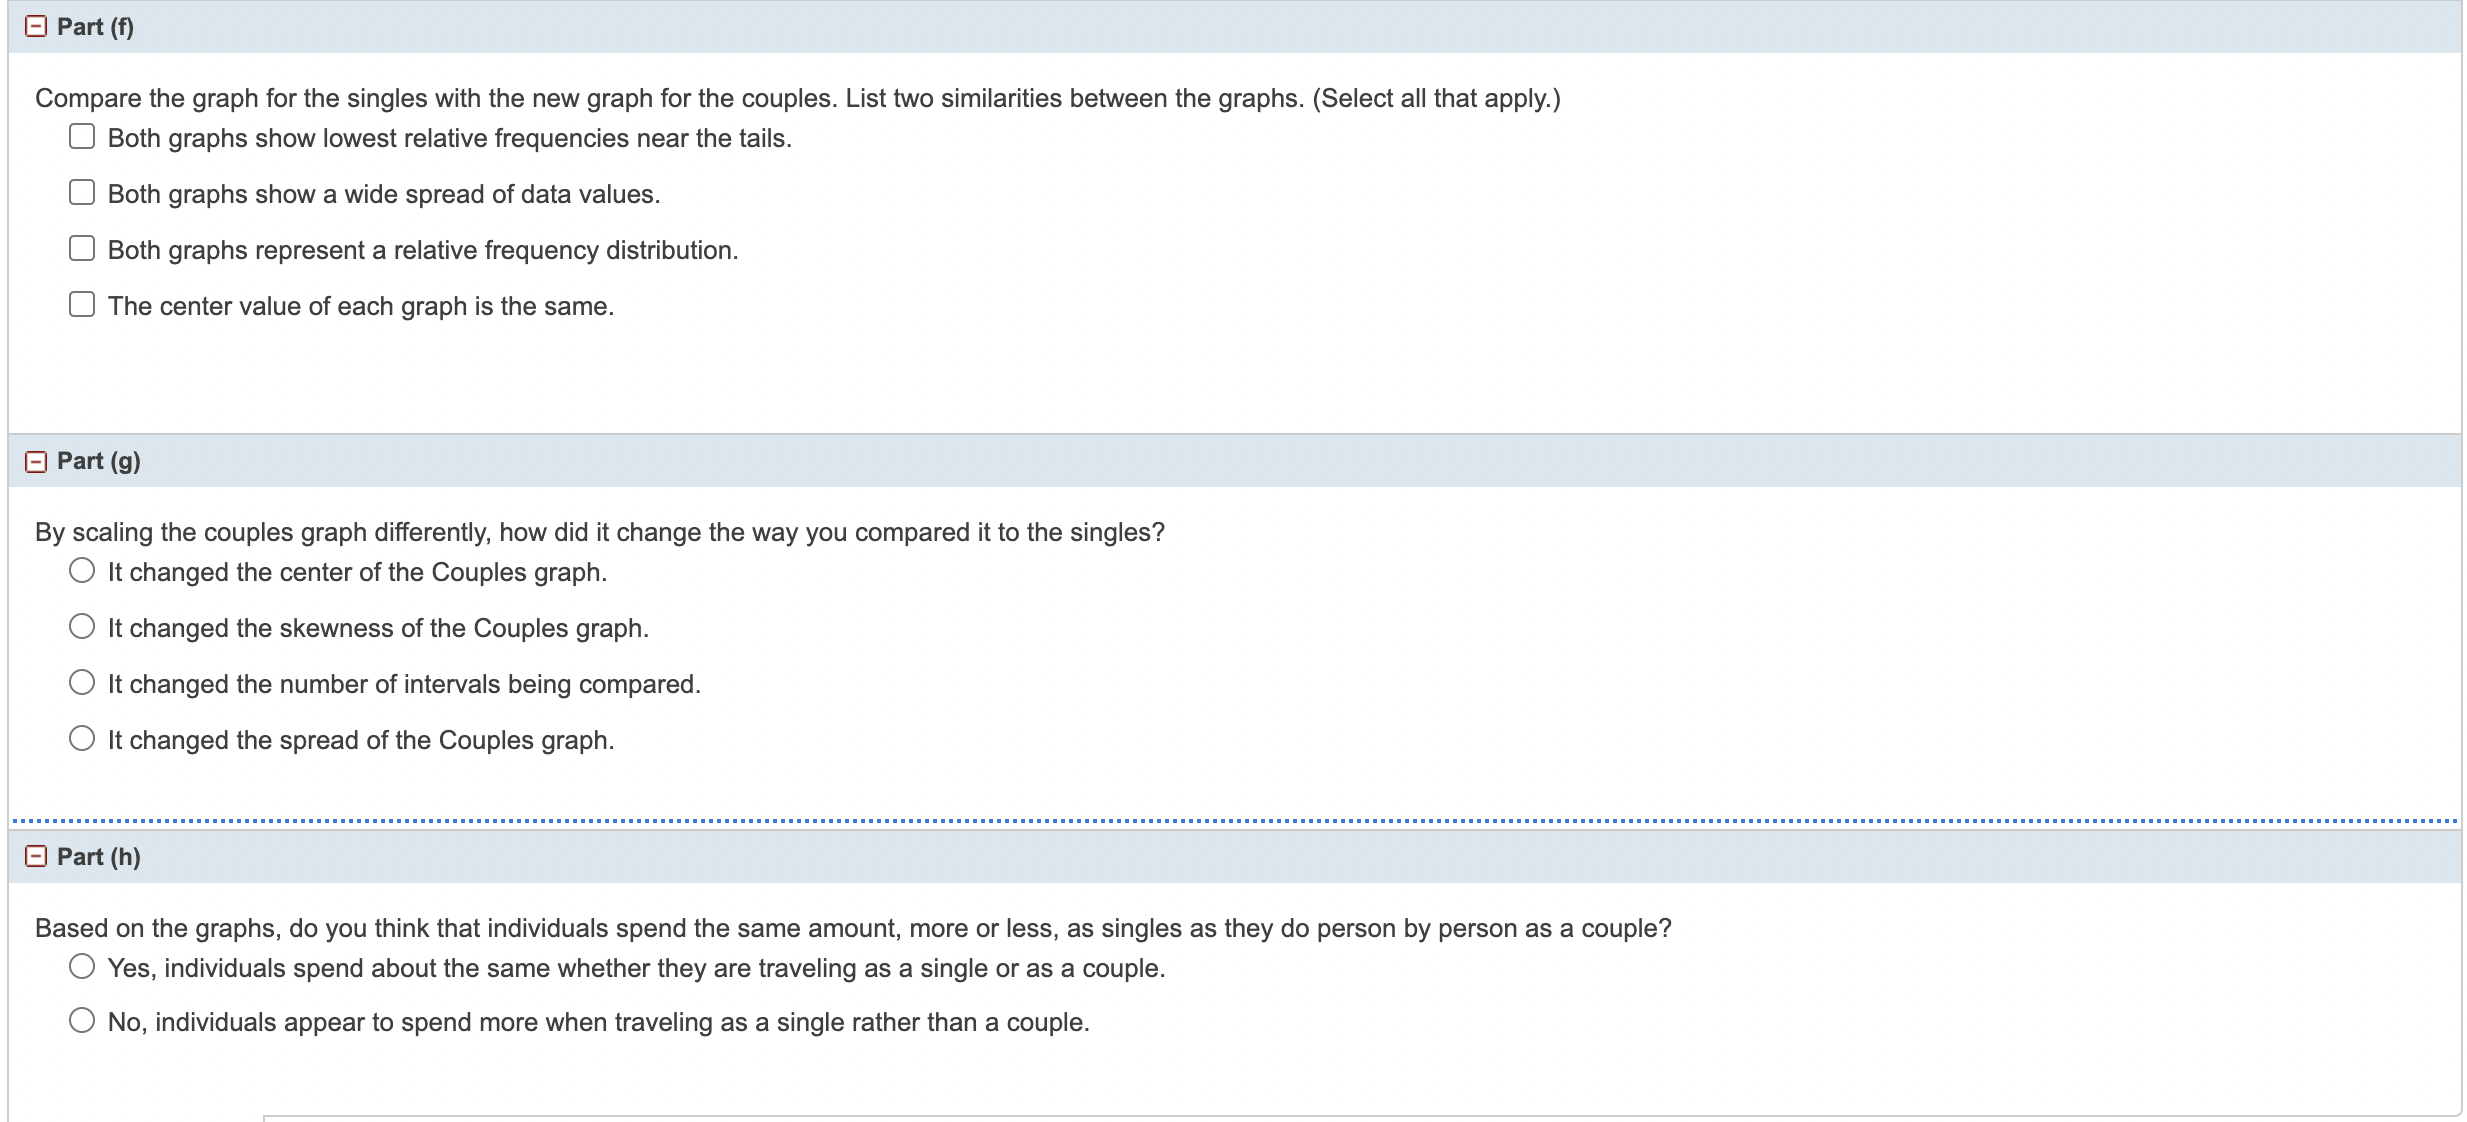
Sixty adults with gum disease were asked the number of times per week they used to floss before their diagnoses. The (incomplete) results are shown below. Flossing Frequency for Adults with Gum Disease # Flossing per Week Frequency Relative Frequency Cumulative Relative Freq. 0 21 0.3500 1 12 3 0.9333 6 3 0.0500 7 1 0.0167 Part (a) Fill in the blanks in the table. (Round your answers for relative frequency and cumulative relative frequency to four decimal places.) Flossing Frequency for Adults with Gum Disease # Flossing per Week Frequency Relative Frequency Cumulative Relative Freq. 0 21 0.3500 1 12 3 0.9333 6 3 0.0500 7 1 0.0167 Part (b) What percent of adults flossed six times per week? (Round your answer to two decimal places.) % Part (c) What percent flossed at most three times per week? (Round your answer to two decimal places.) %... VA Chapter 2 - Descriptive Stat X VA Quiz #1 (Chapters 1 & 2) - N X =2.7 Measures of the Spread X 2.3 Measures of the Locatic X 2.2 Histograms, Frequency X + C webassign.net/web/Student/Assignment-Responses/last?dep=27799978 N . . . Part (a) Fill in the relative frequency for each group. (Round your answers to four decimal places.) Singles Amount ($) Frequency Relative Frequency 51-100 6 101-150 11 151-200 15 201-250 15 251-300 11 301-350 6 Couples Amount ($) Frequency Relative Frequency 100-150 6 151-200 6 201-250 6 251-300 6 301-350 12 351-400 12 401-450 12 451-500 12 501-550 6 551-600 6- Part (b) Construct a histogram for the singles group. Scale the x-axis by $50 widths. Use relative frequency on the y-axis. Relative Frequency Relative Frequency 0.20 0.25 0.15 0.20 0.15 0.10 0.10 0.05 0.05 0.00 Amount ($) 0.00 50 100 150 200 250 300 350 Amount ($) O O 50 100 150 200 250 300 350 Relative Frequency Relative Frequency 15 15 10 10 5 5 Amount ($) 0 Amount ($) O 50 100 150 200 250 300 350 O 50 100 150 200 250 300 350Construct a histogram for the couples group. Scale the x-axis by $50 widths. Use relative frequency on the y-axis. Relative frequency Relative Frequency 12 10 0.14 0.12 0.10 0.08 0.06 0.04 0.02 0.00 Amount (5) Amount (3) O 100200300400500600 O 100200300400500600 Relative Frequency Relative Frequency 12 0.14 10 0.12 0.10 0.08 0.06 0.04 0.02 Amount (5) . Amount (3) O 100200300400500600 O 100200300400500600 El Part (d) Compare the two graphs: (i) List two similarities between the graphs. (Select all that apply.) Both graphs represent a relative frequency distribution. The bars of each graph represent an interval of $50. Both graphs show a wide spread of the data. _ Both graphs represent a bimodal distribution. (ii) List two differences between the graphs. (Select all that apply.) _ One graph is skewed to the right and the other graph is not. _ One graph is bimodal and the other graph is not bimodal. The center of each distribution is different. One graph is symmetrical and the other graph is not symmetrical. Constmct a new graph for the couples by hand. Since each couple is paying for two individuals, instead of scaling the x-axis by $50, scale it by $100. Use relative frequency on the y-axis. Relative Frequency Relative Frequency 0.30 25 0.25 20 0.20 0.15 15 0.10 1 0.05 5 0.00 Amount (8) 0 Amount (8) O 100200300400500600 O 100200300400500600 Relative frequency Relative frequency 25 20 15 0.30 0.25 0.20 0.15 10 0.10 5 0.05 0 Amount 6) 0.00 Amount (3) O 100200300400500600 O 100200300400500600 I3 Part (I) Compare the graph for the singles with the new graph for the couples. List two similarities between the graphs. (Select all that apply.) Both graphs show lowest relative frequencies near the tails. Both graphs show a wide spread of data values. Both graphs represent a relative frequency distribution. The center value of each graph is the same. l3 Pan (9) By scaling the couples graph differently, how did it change the way you compared it to the singles? 0 It changed the center of the Couples graph. 0 It changed the skewness of the Couples graph. 0 It changed the number of intervals being compared. Q It changed the spread of the Couples graph. El Part (h) Based on the graphs, do you think that individuals spend the same amount, more or less, as singles as they do person by person as a couple? 0 Yes, individuals spend about the same whether they are traveling as a single or as a couple. 0 No, individuals appear to spend more when traveling as a single rather than a couple