Answered step by step
Verified Expert Solution
Link Copied!

Question

1 Approved Answer

Sixty students were given a history exam. Their scores are shown below, sorted from smallest to largest. 12 33 38 39 39 40 40 42
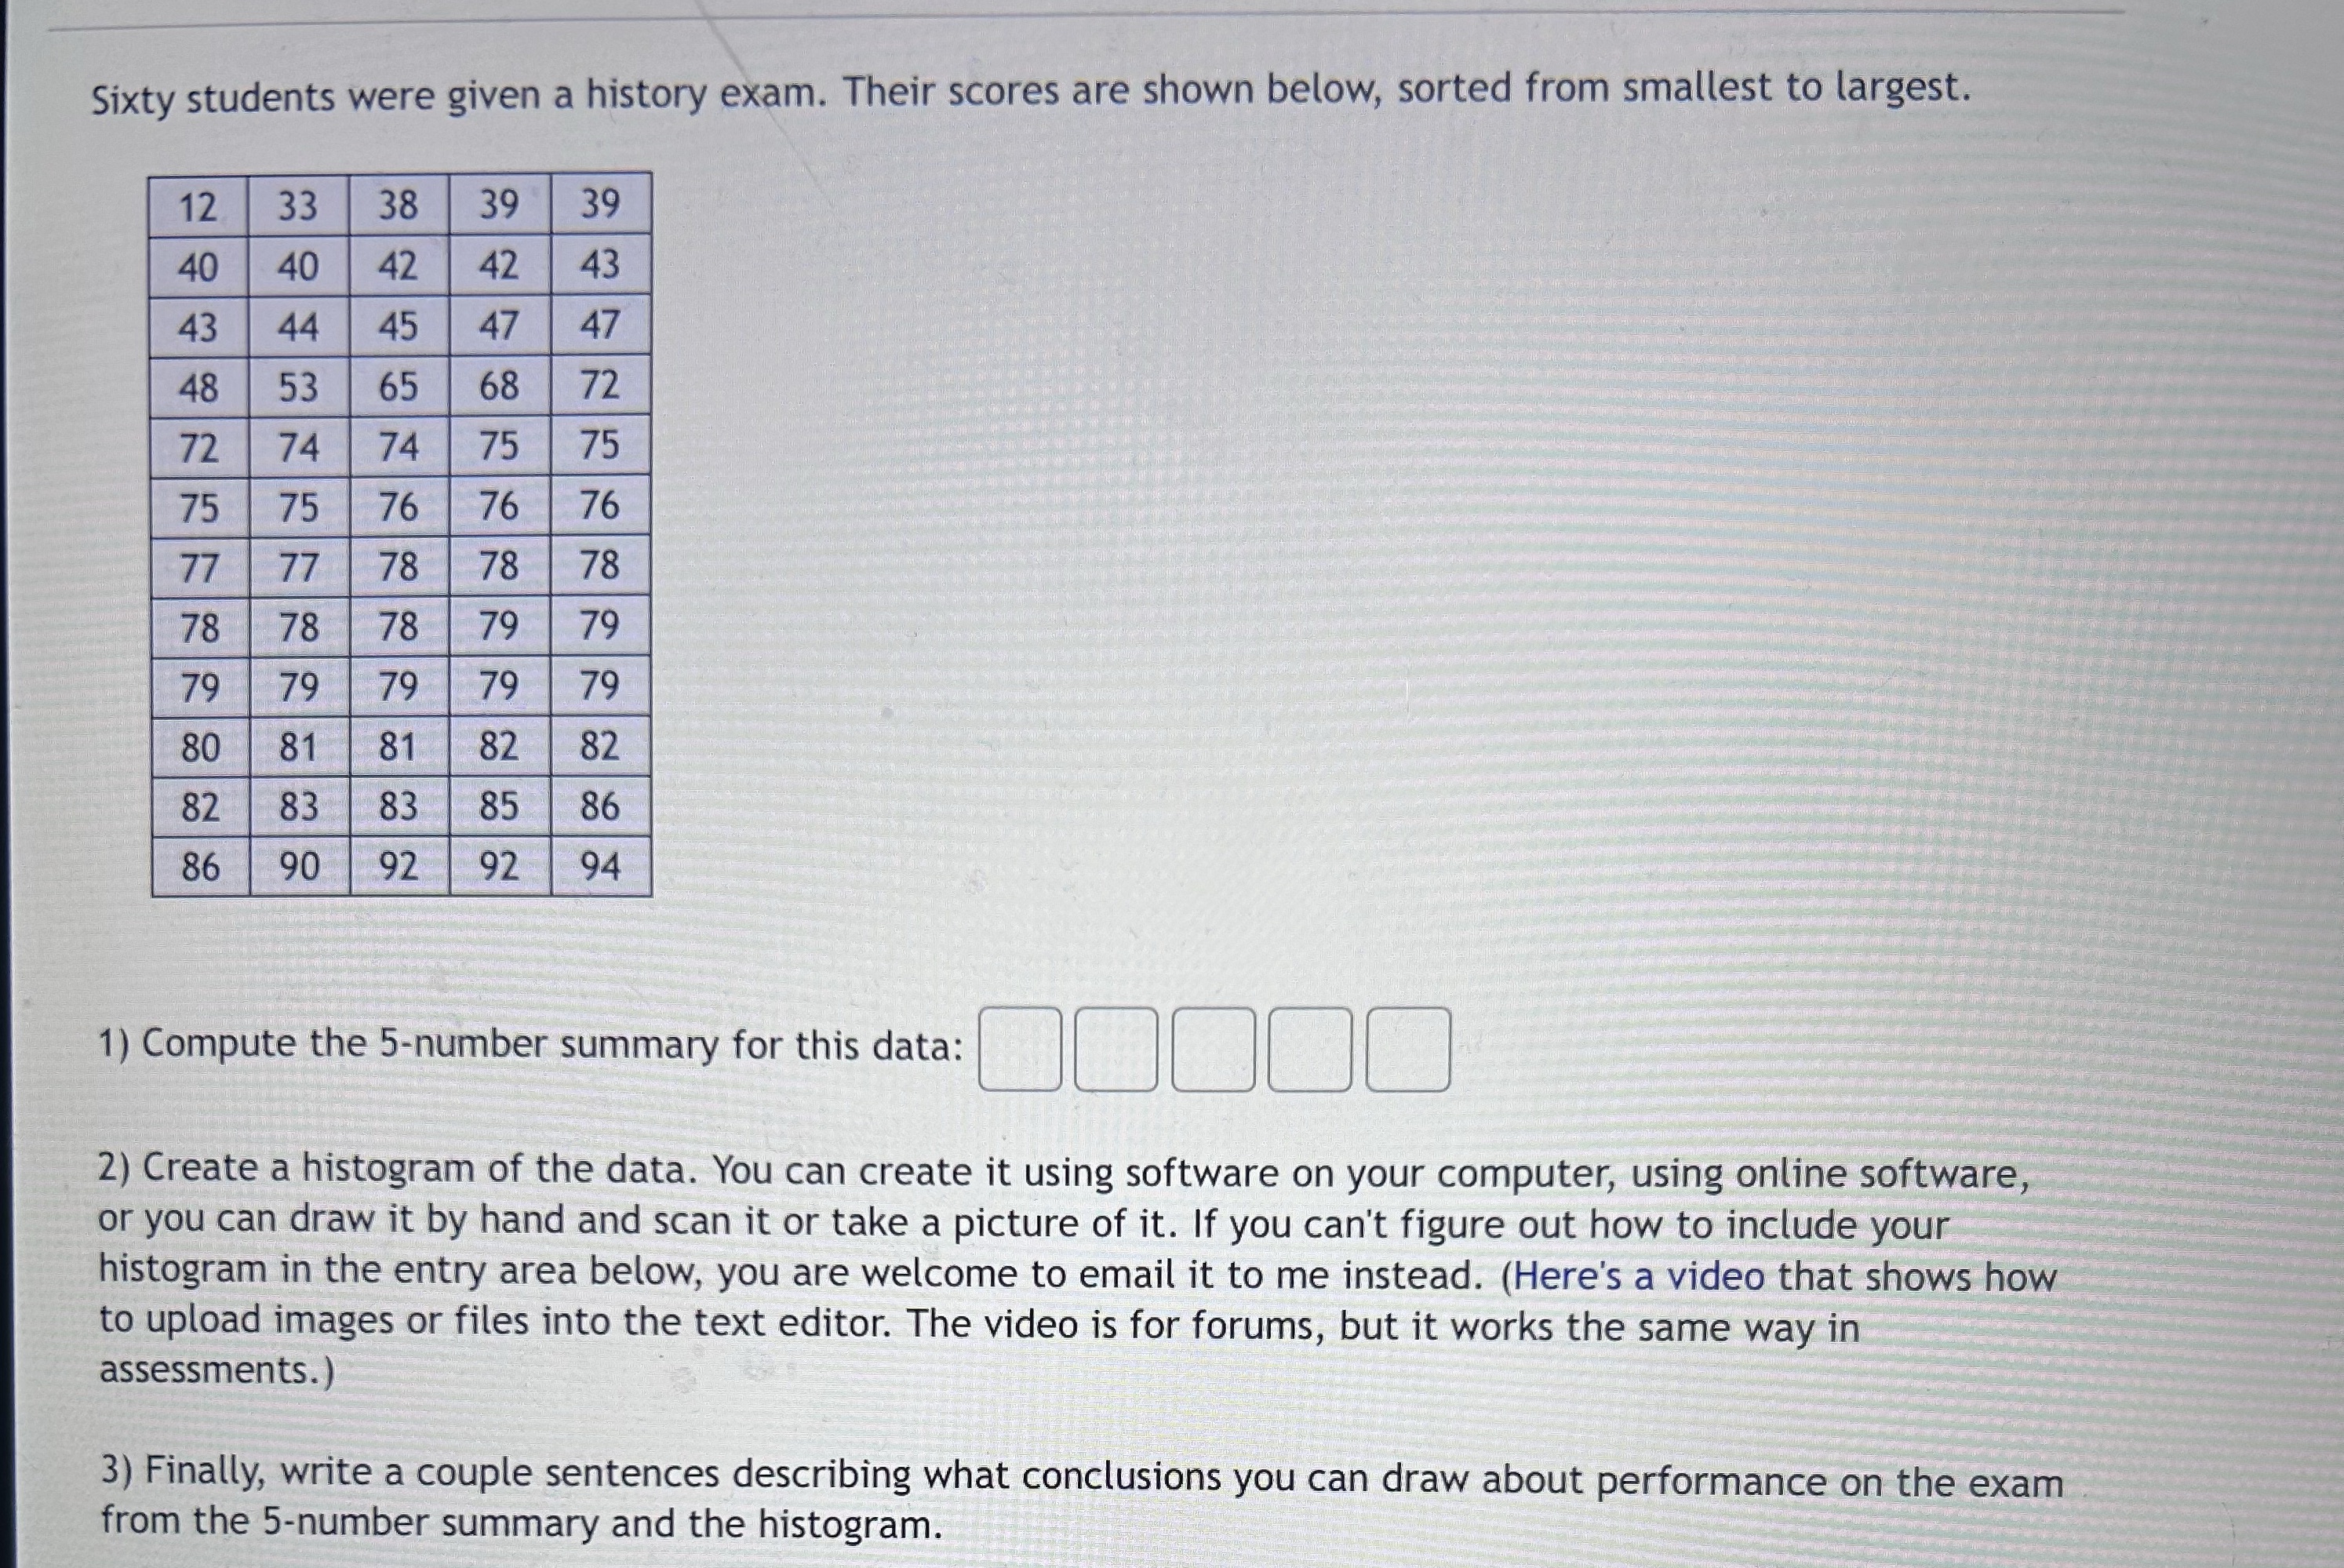
image text in transcribed
Sixty students were given a history exam. Their scores are shown below, sorted from smallest to largest. 12 33 38 39 39 40 40 42 42 43 43 44 45 47 47 48 53 65 68 72 72 74 74 75 75 75 75 76 76 76 77 77 78 78 78 78 78 78 79 79 79 79 79 79 79 80 81 81 82 82 82 83 83 85 86 86 90 92 92 94 1) Compute the 5-number summary for this data: 2) Create a histogram of the data. You can create it using software on your computer, using online software, or you can draw it by hand and scan it or take a picture of it. If you can't figure out how to include your histogram in the entry area below, you are welcome to email it to me instead. (Here's a video that shows how to upload images or files into the text editor. The video is for forums, but it works the same way in assessments. ) 3) Finally, write a couple sentences describing what conclusions you can draw about performance on the exam from the 5-number summary and the histogram

Step by Step Solution

There are 3 Steps involved in it

Step: 1

blur-text-image

Get Instant Access to Expert-Tailored Solutions

See step-by-step solutions with expert insights and AI powered tools for academic success

Step: 2

blur-text-image

Step: 3

blur-text-image

Ace Your Homework with AI

Get the answers you need in no time with our AI-driven, step-by-step assistance

Get Started

Recommended Textbook for

Essentials of Business Analytics

Authors: Jeffrey D. Camm, James J. Cochran, Michael J. Fry, Jeffrey W. Ohlmann, David R. Anderson

2nd edition

1305627733, 978-1305861817, 1305861817, 978-0357688960, 978-1305627734

More Books

Students also viewed these Mathematics questions

Question

How much do your readers know about your topic?

Answered: 1 week ago