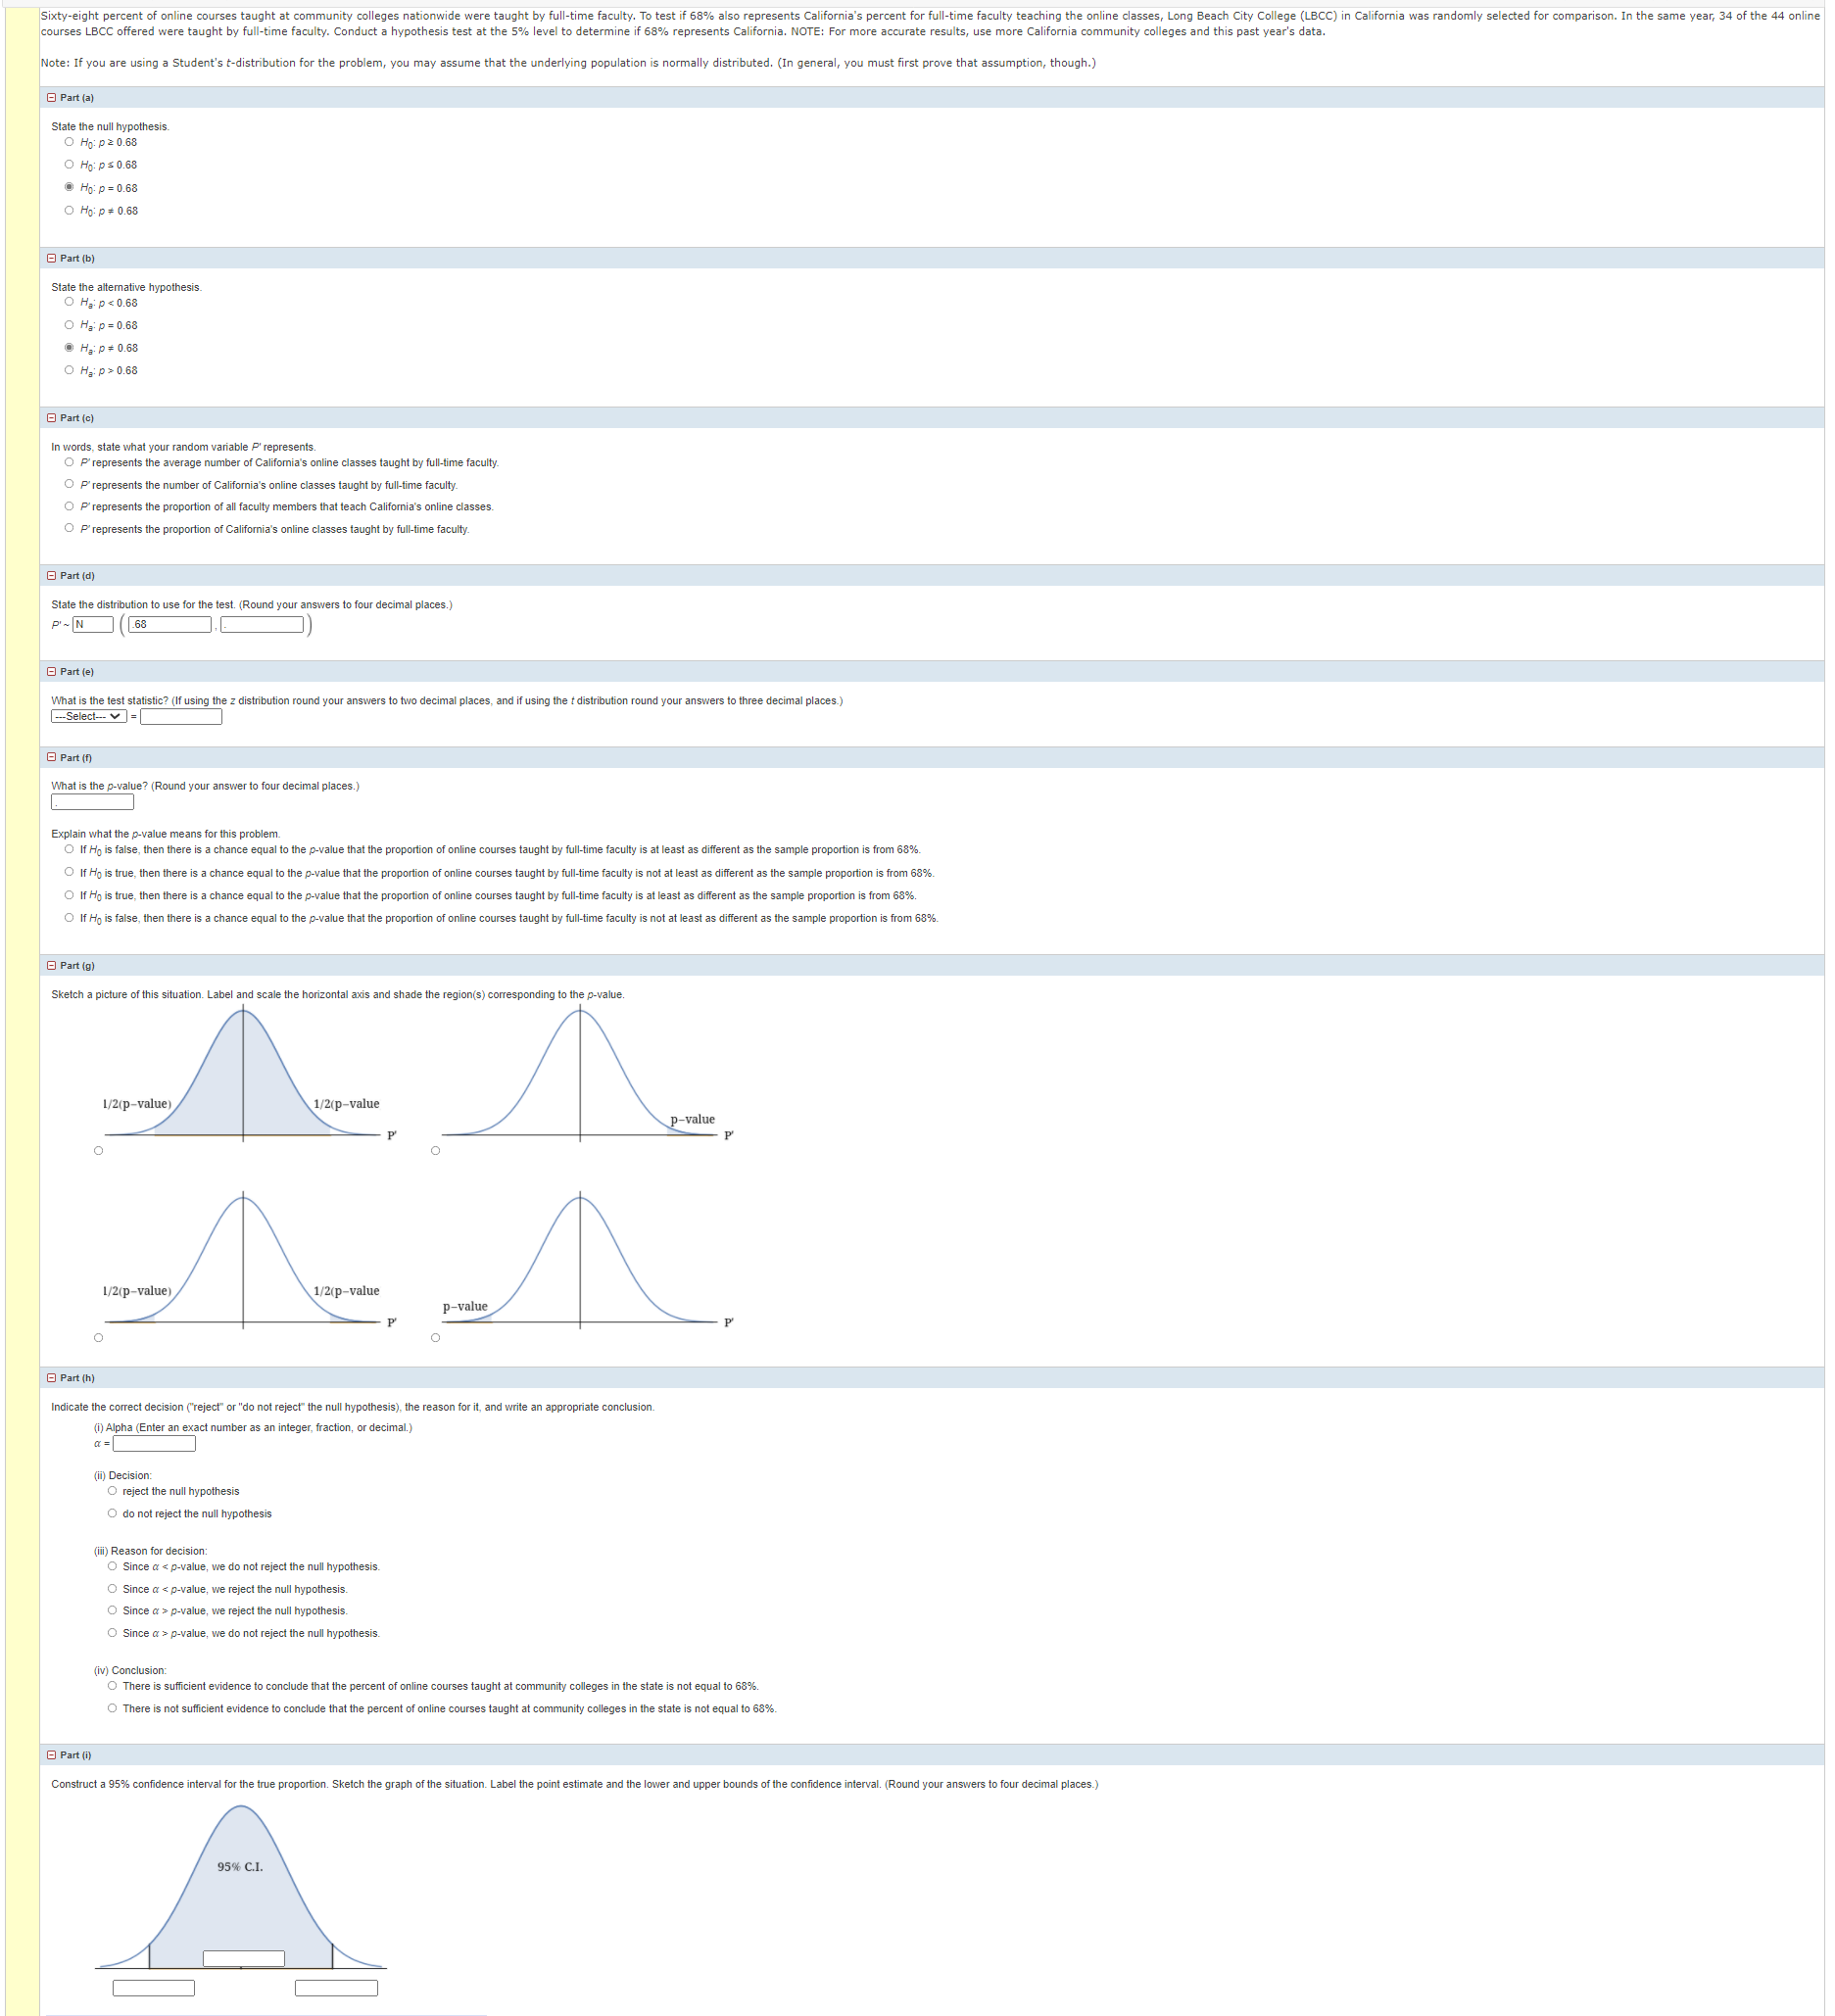
Sixty-eight percent of online courses taught at com hewants taught at community colleges nationwide were taught by full ere taught by full-time faculty. To test
Sixty-eight percent of online courses taught at com hewants taught at community colleges nationwide were taught by full ere taught by full-time faculty. To test if 68% also represents California's percent for full-time faculty courses LBCC offered were taught by full-time faculty. Conduct a hypothesis test at the 5% level to determine if 68% represents California. NOTE: For more accurate results, use more California community colleges and this past year's data. Note: If you are using a Student's t-distribution for the problem, you may assume that the underlying population is normally distributed. (In general, you must first prove that assumption, though.) Part ( a ) State the null hypothesis . O Ho: p = 0.68 O Ho : P 5 0.68 Ho: p = 0.68 Ho: p = 0.68 Part ( b ) State the alternativ O Ha p 0.68 Part (c ) In words, state what your random variable P' represents. O P represents the average number of California's online classes taught by full-time faculty. O P represents the number of California's online classes taught by full-time faculty. presents the proportion of all faculty members that teach California's online classes. OF represents the proportion of California's online classes taught by full-time faculty. Part ( d ) State the distribution to use for the test. (Round your answers to four decimal places . ) P'- N 68 Part ( e ) What is the test statistic? (If using the z distribution round your answers to two decimal places, and if using the t distribution round your answers to three decimal places.) Part ( f ) What is the p-value? (Round your answer to four decimal places.) Explain what the p-value means for this problem. If Ho is false, then there is a chance equal to the p-val ferent as the sample proportion is from 68%. O If Ho is true, then there is a chance equal to is not at least as different as the sample proportion is from 68%. O If Ho is true, then there is a chance aught by full-time faculty is at least as different as the sample proportion is from 68%. O If Ho is false, then there is a cha ight by full-time faculty is not at least as different as the sample proportion is from 68% Part (9) Sketch a picture of this situation. Label and scale the horizontal axis and shade the region(s) corresponding to the p-value. 1/2(p-value 1/2(p-value p-value 1/2(p-value 1/2(p-value p-value Part (h e the correct decision ('reject or "do not reject" the null hypothesis), the reason for it, and write an appropriate conclusion. (1) Alpha (Enter an exact number as an integer, fraction, or decimal.) i) Decision: O reject the null hypothesis do not reject the null hypothesis ii) Reason for decision: O Since a p-value, we reject the null hypothesis Since a > p-value, we do not reject the null hypothesis. iv) Conclusion: There is sufficient evidence to conclude that the percent of online courses ta colleges in the state is not equal to 689%. O There is not sufficient evidence to conclude that the percent of online courses taught at community colleges in the state is not equal to 68%. Part (i) Construct a 95% confidence interval for the true proportion. Sketch the graph of the situation. Label the point estimate and the lower and upper bounds of the confidence interval. (Round your answers to four decimal places.) 95% C.I
Step by Step Solution
There are 3 Steps involved in it
Step: 1
Get Instant Access to Expert-Tailored Solutions
See step-by-step solutions with expert insights and AI powered tools for academic success
Step: 2
Step: 3
Ace Your Homework with AI
Get the answers you need in no time with our AI-driven, step-by-step assistance