Answered step by step
Verified Expert Solution
Question
1 Approved Answer
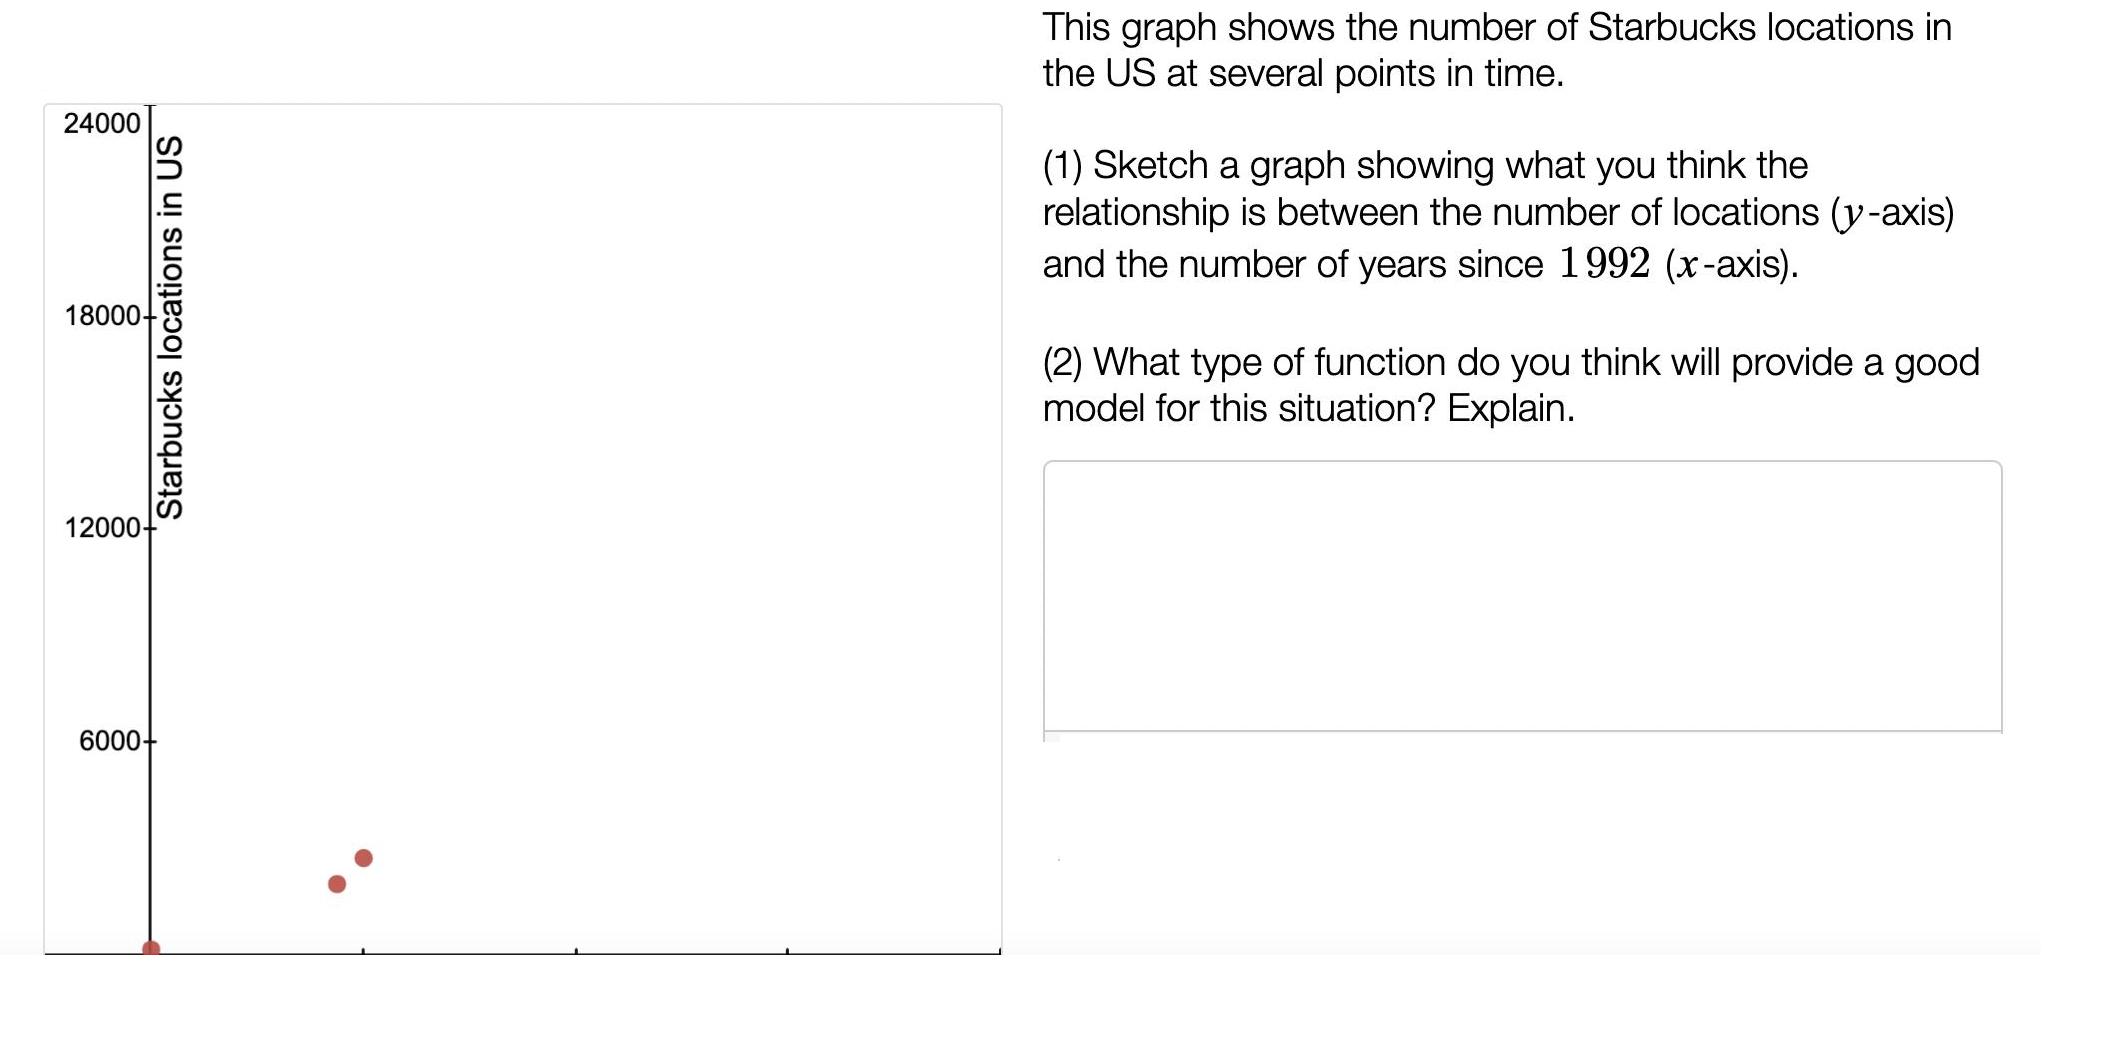
Sketch a Graph: 24000 18000- 12000- 6000- Starbucks locations in US This graph shows the number of Starbucks locations in the US at several points
Sketch a Graph:

24000 18000- 12000- 6000- Starbucks locations in US This graph shows the number of Starbucks locations in the US at several points in time. (1) Sketch a graph showing what you think the relationship is between the number of locations (y-axis) and the number of years since 1992 (x-axis). (2) What type of function do you think will provide a good model for this situation? Explain.
Step by Step Solution
★★★★★
3.48 Rating (148 Votes )
There are 3 Steps involved in it
Step: 1
a This could be the relationship ...
Get Instant Access to Expert-Tailored Solutions
See step-by-step solutions with expert insights and AI powered tools for academic success
Step: 2

Step: 3

Ace Your Homework with AI
Get the answers you need in no time with our AI-driven, step-by-step assistance
Get Started


