

Answered step by step
Verified Expert Solution
Question
1 Approved Answer
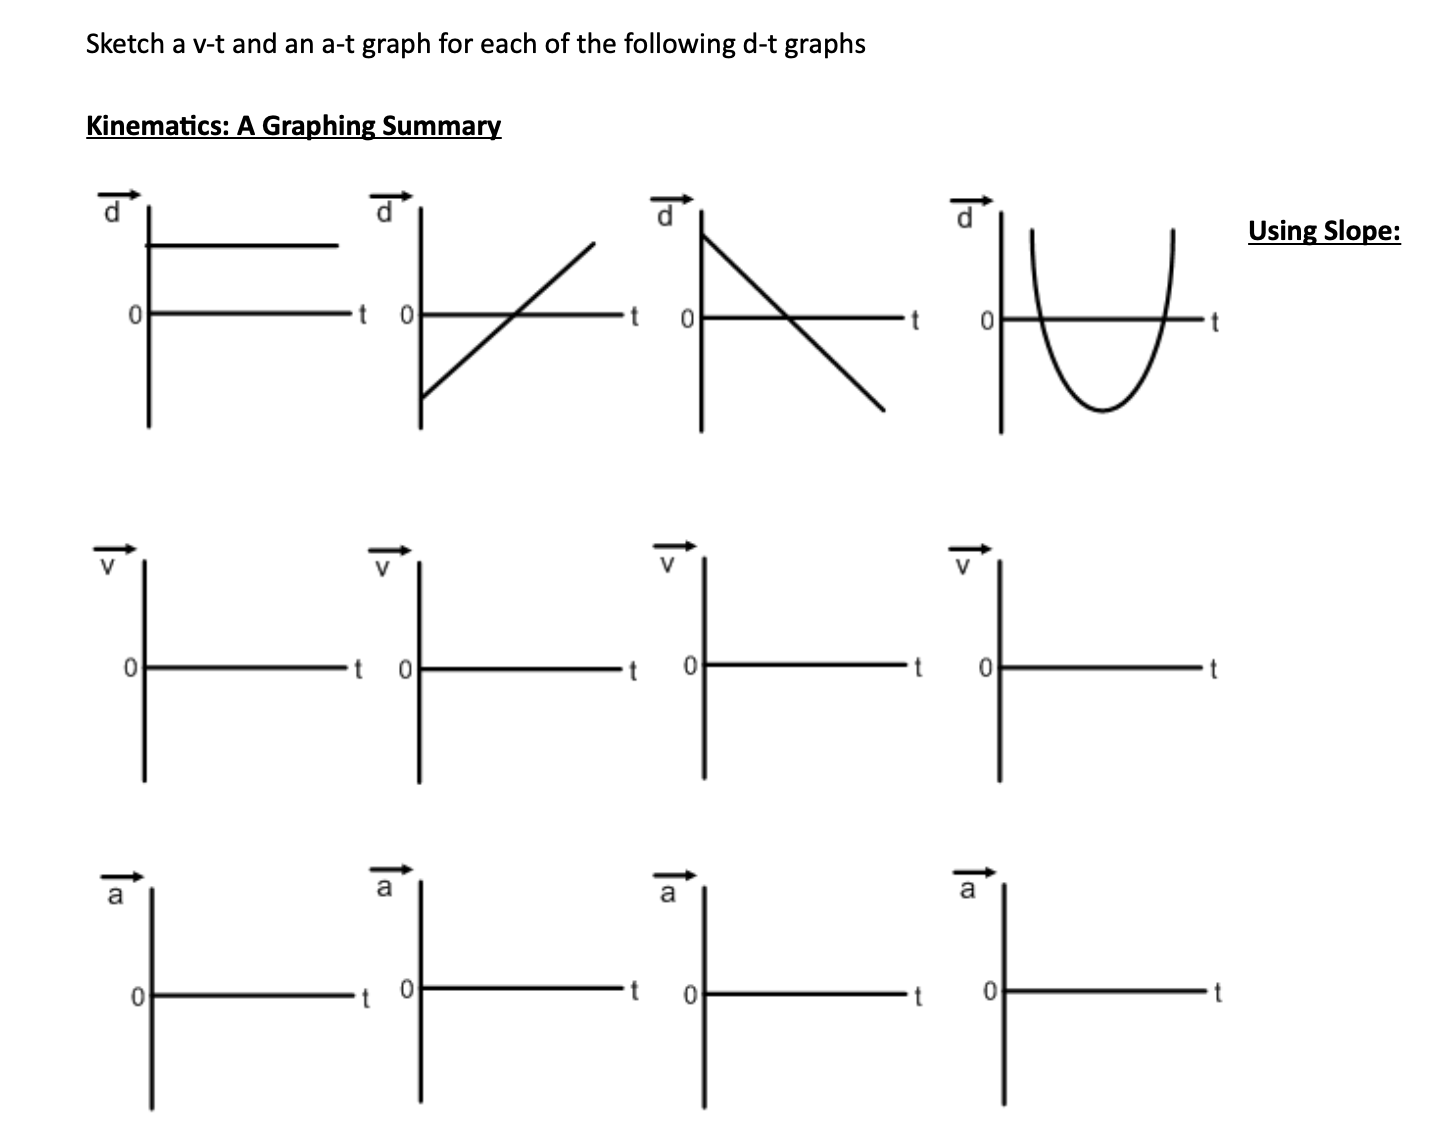
Sketch a v-t and an a-t graph for each of the following d-t graphs Kinematics: A Graphing Summary d Using Slope: 0 t o t
Step by Step Solution
There are 3 Steps involved in it
Step: 1

Get Instant Access to Expert-Tailored Solutions
See step-by-step solutions with expert insights and AI powered tools for academic success
Step: 2

Step: 3
Ace Your Homework with AI
Get the answers you need in no time with our AI-driven, step-by-step assistance
Get Started
Fundamentals of Physics
Authors: Jearl Walker, Halliday Resnick
8th Extended edition
471758019, 978-0471758013