Question
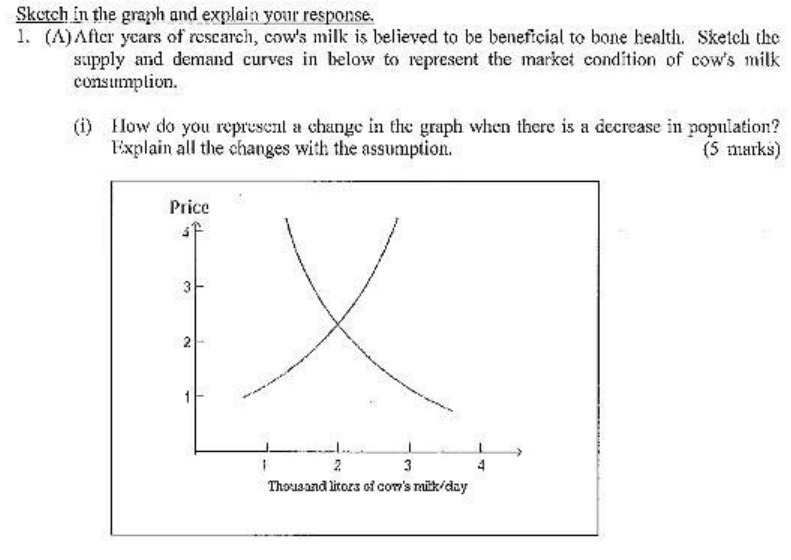
Sketch in the graph and explain your response. 1. (A) After years of research, cow's milk is believed to be beneficial to bone health.

Sketch in the graph and explain your response. 1. (A) After years of research, cow's milk is believed to be beneficial to bone health. Sketch the supply and demand curves in below to represent the market condition of cow's milk consumption. (i) How do you represent a change in the graph when there is a decrease in population? Explain all the changes with the assumption. Price (5 marks) 0 2 2 3 Thousand litors of cow's milk/day
Step by Step Solution
There are 3 Steps involved in it
Step: 1

Get Instant Access to Expert-Tailored Solutions
See step-by-step solutions with expert insights and AI powered tools for academic success
Step: 2

Step: 3

Ace Your Homework with AI
Get the answers you need in no time with our AI-driven, step-by-step assistance
Get StartedRecommended Textbook for
Physics
Authors: Alan Giambattista, Betty Richardson, Robert Richardson
2nd edition
77339681, 978-0077339685
Students also viewed these Economics questions
Question
Answered: 1 week ago
Question
Answered: 1 week ago
Question
Answered: 1 week ago
Question
Answered: 1 week ago
Question
Answered: 1 week ago
Question
Answered: 1 week ago
Question
Answered: 1 week ago
Question
Answered: 1 week ago
Question
Answered: 1 week ago
Question
Answered: 1 week ago
Question
Answered: 1 week ago
Question
Answered: 1 week ago
Question
Answered: 1 week ago
Question
Answered: 1 week ago
Question
Answered: 1 week ago
Question
Answered: 1 week ago
Question
Answered: 1 week ago
Question
Answered: 1 week ago
Question
Answered: 1 week ago
Question
Answered: 1 week ago
Question
Answered: 1 week ago
Question
Answered: 1 week ago
View Answer in SolutionInn App


