Answered step by step
Verified Expert Solution
Link Copied!

Question

1 Approved Answer

sketch int_(-3) Sketch the cobweb for the iteration x=g(x) on the graph of g(x) starting at the value x=-0.2 for 3 iterations of x=g(x)

sketch

\\\\int_(-3)

\ Sketch the cobweb for the iteration

x=g(x)

on the graph of

g(x)

starting at the value

x=-0.2

for\ 3 iterations of

x=g(x)

. The sketch does not have to be precise. List the values of

x

at these 3\ iterations in format short. Explain what happens as you increase the number of iterations and why\ it happens.\

O V E R Longrightarrow
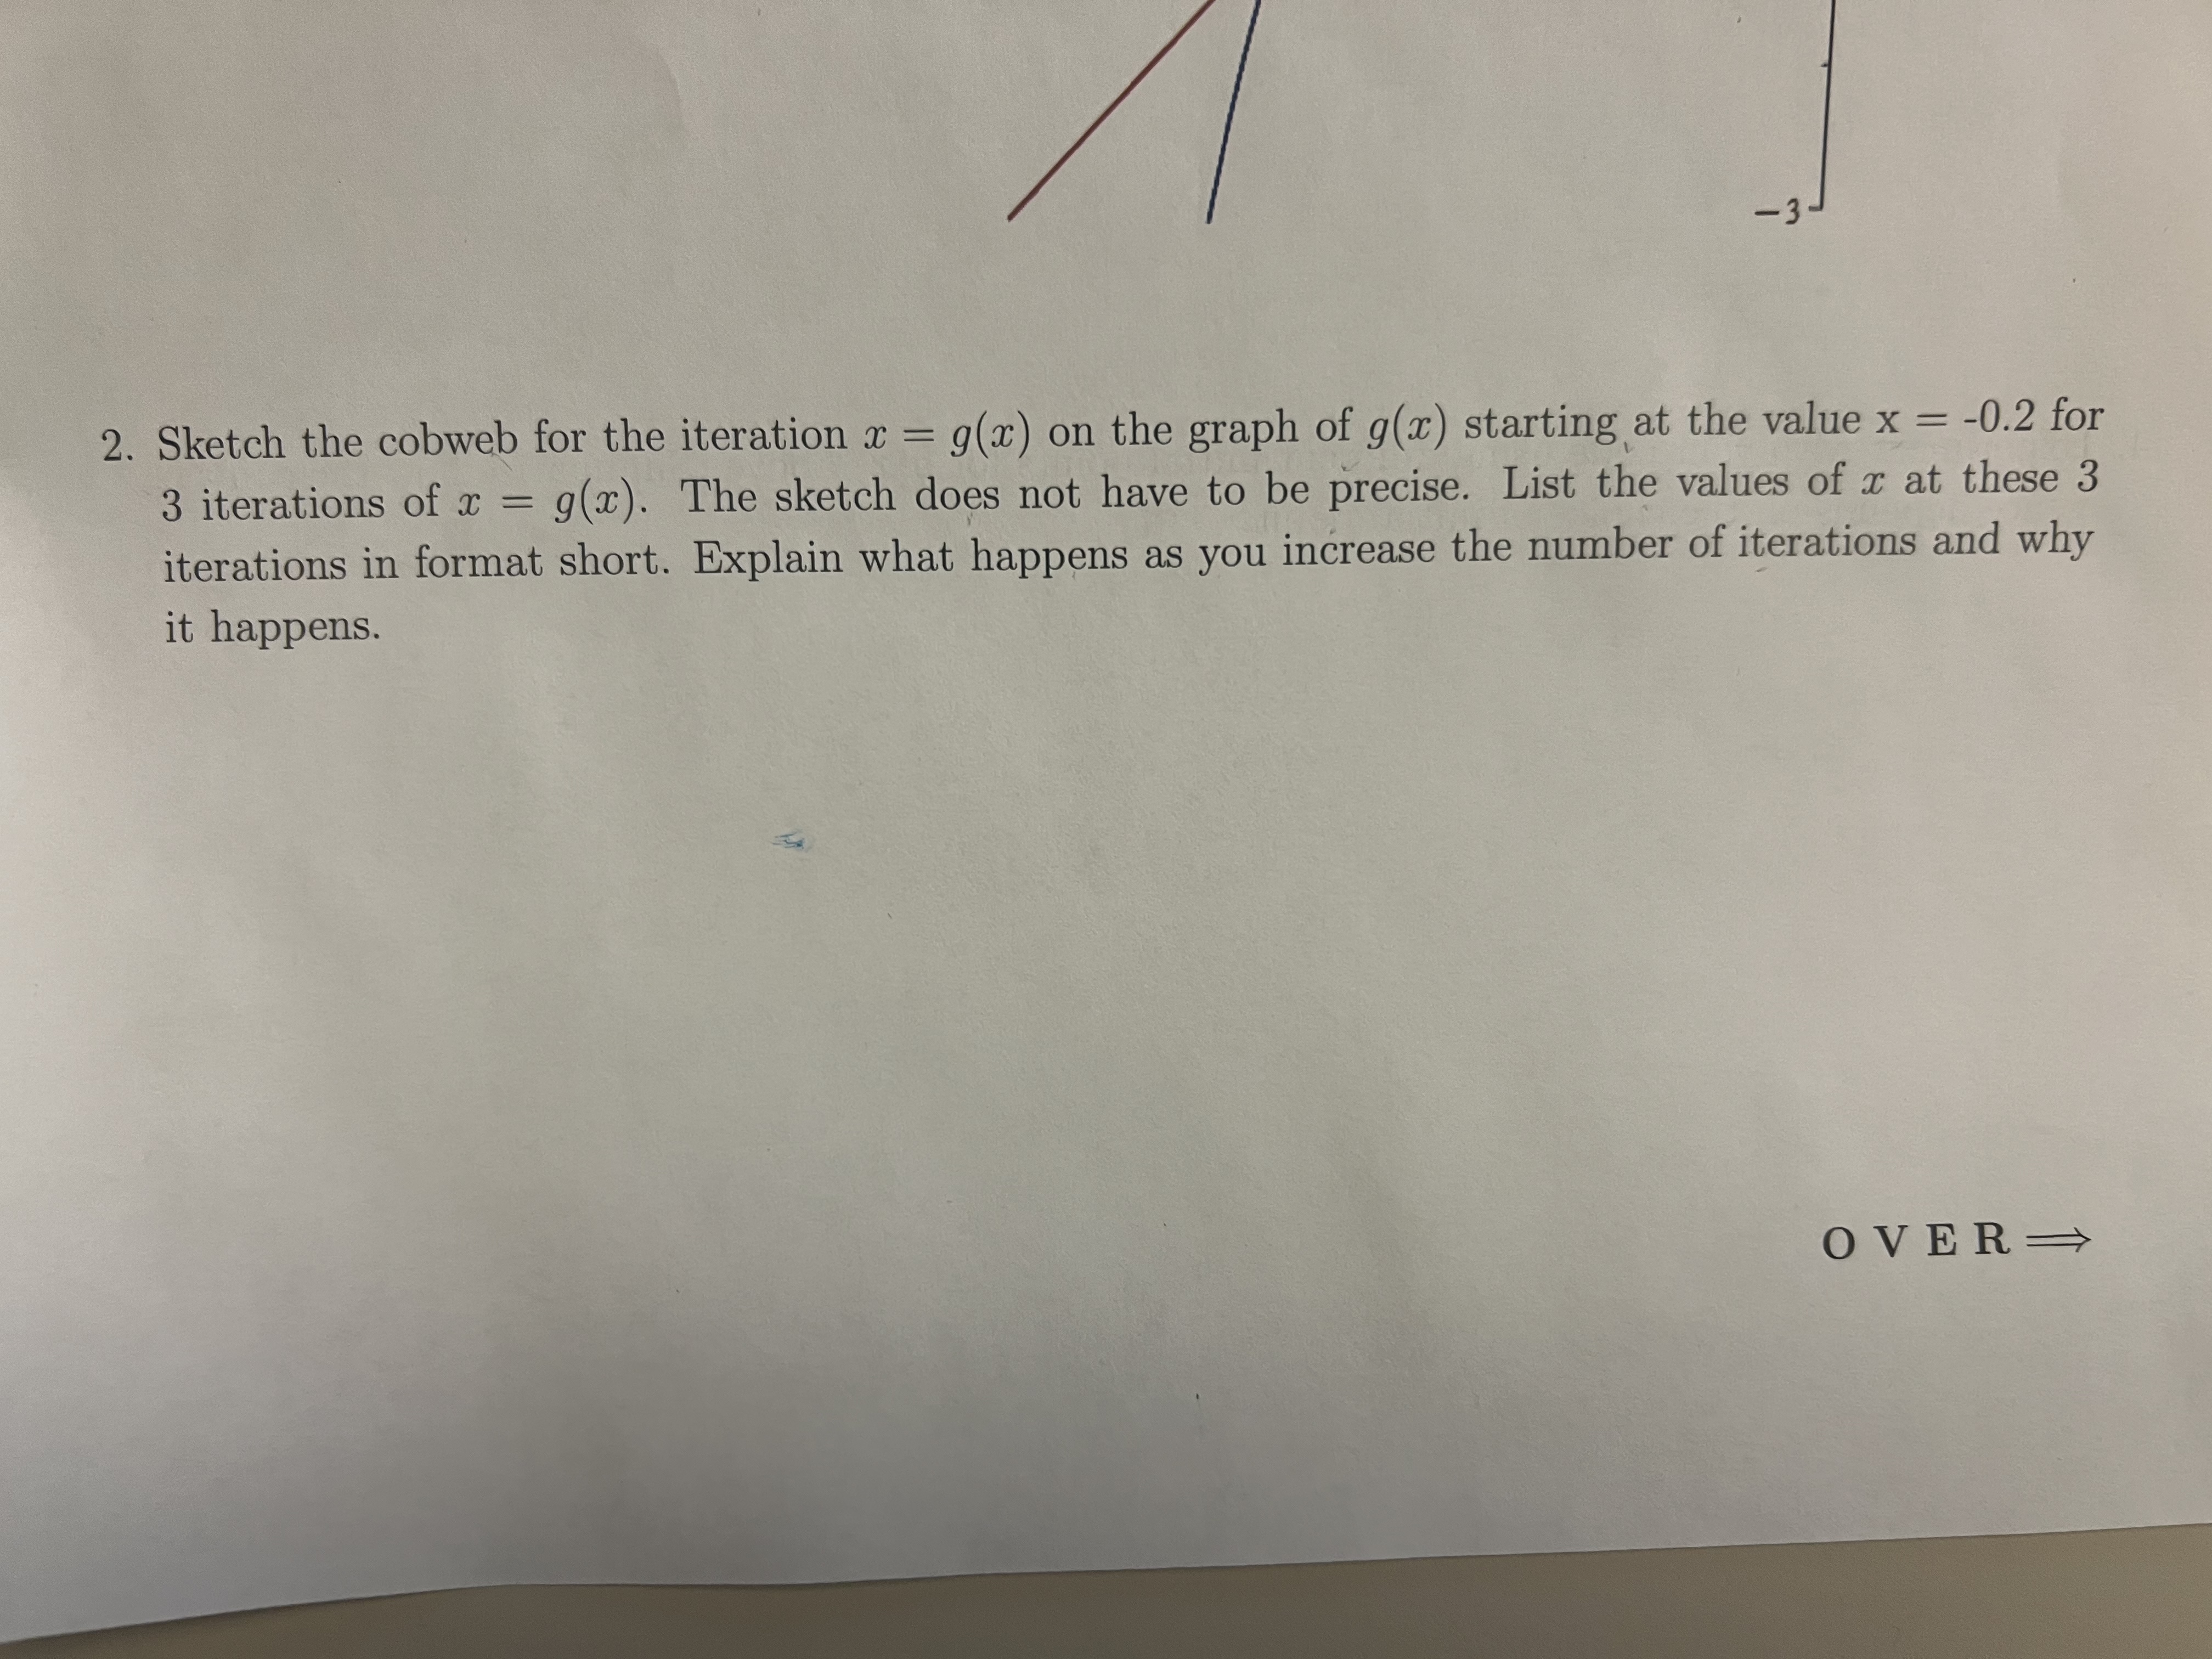
image text in transcribed
2. Sketch the cobweb for the iteration x=g(x) on the graph of g(x) starting at the value x=0.2 for 3 iterations of x=g(x). The sketch does not have to be precise. List the values of x at these 3 iterations in format short. Explain what happens as you increase the number of iterations and why it happens. 2. Sketch the cobweb for the iteration x=g(x) on the graph of g(x) starting at the value x=0.2 for 3 iterations of x=g(x). The sketch does not have to be precise. List the values of x at these 3 iterations in format short. Explain what happens as you increase the number of iterations and why it happens

Step by Step Solution

There are 3 Steps involved in it

Step: 1

blur-text-image

Get Instant Access to Expert-Tailored Solutions

See step-by-step solutions with expert insights and AI powered tools for academic success

Step: 2

blur-text-image

Step: 3

blur-text-image

Ace Your Homework with AI

Get the answers you need in no time with our AI-driven, step-by-step assistance

Get Started

Recommended Textbook for

Case Studies In Business Data Bases

Authors: James Bradley

1st Edition

0030141346, 978-0030141348

More Books

Students also viewed these Databases questions