Answered step by step
Verified Expert Solution
Link Copied!

Question

1 Approved Answer

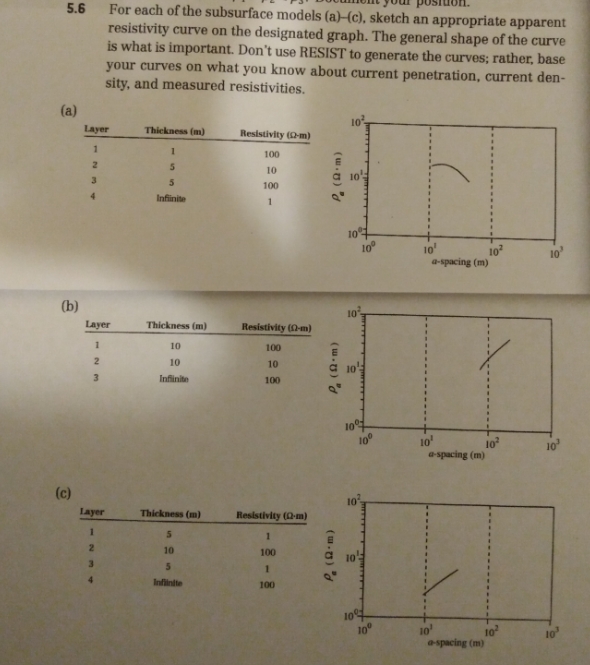
Sketch the resistivity curves for each set of data in A, B, and C 5.6 For each of the subsurface models (a)-(c), sketch an appropriate

Sketch the resistivity curves for each set of data in A, B, and C

image text in transcribed
5.6 For each of the subsurface models (a)-(c), sketch an appropriate apparent resistivity curve on the designated graph. The general shape of the curve is what is important. Don't use RESIST to generate the curves; rather, base your curves on what you know about current penetration, current den- sity, and measured resistivities. (a) 102 Layer Thickness (m) Resistivity (0-m) 100 10 P (Q . m) 100 Infinite 10 10 10' 10 a-spacing (m) (b) Laver Thickness (m) Hesistivity (0-m) 10 100 10 P (Q . m) 10 Infillnite 100 1097 10 10 a-sparing (m) (c) 10' Layer Thickness (m) Resistivity (Q.m) 1 5 1 10 100 P (Q .m) 10 100 10 102 10" a-spacing (m)

Step by Step Solution

There are 3 Steps involved in it

Step: 1

blur-text-image

Get Instant Access to Expert-Tailored Solutions

See step-by-step solutions with expert insights and AI powered tools for academic success

Step: 2

blur-text-image

Step: 3

blur-text-image

Ace Your Homework with AI

Get the answers you need in no time with our AI-driven, step-by-step assistance

Get Started

Recommended Textbook for

Fundamentals of Physics

Authors: Jearl Walker, Halliday Resnick

9th Edition

470469080, 470556536, 470469110, 9780470469088, 9780470556535, 978-0470469118

More Books

Students also viewed these Physics questions