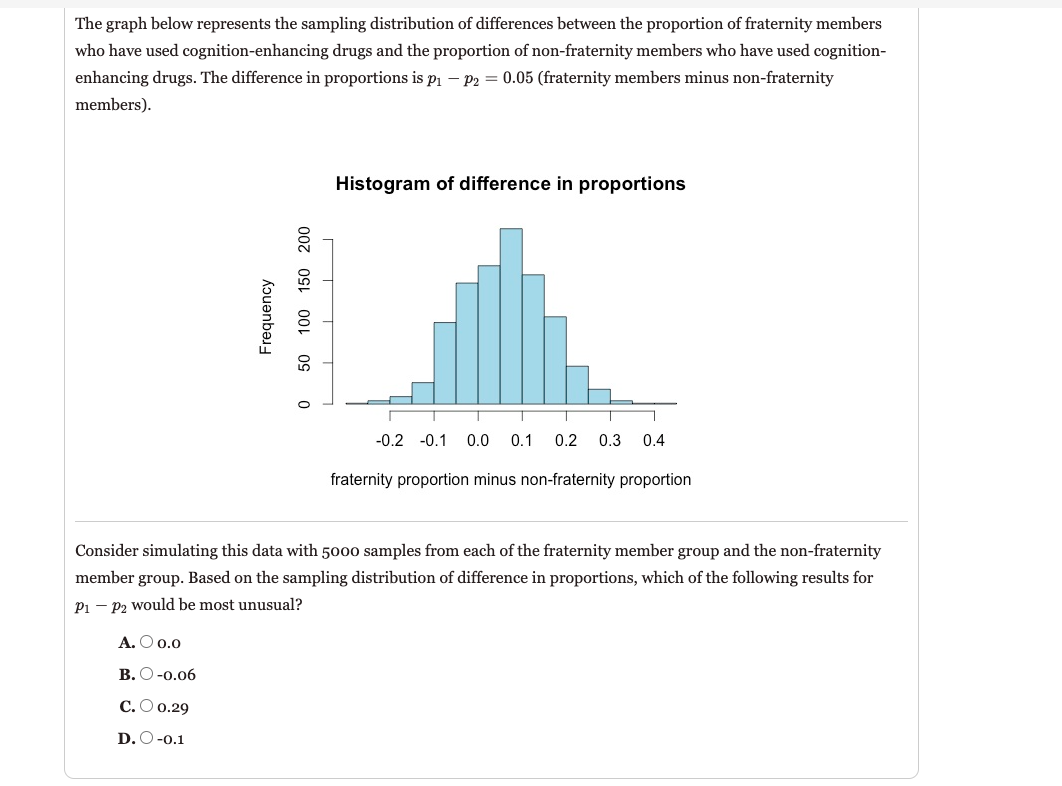
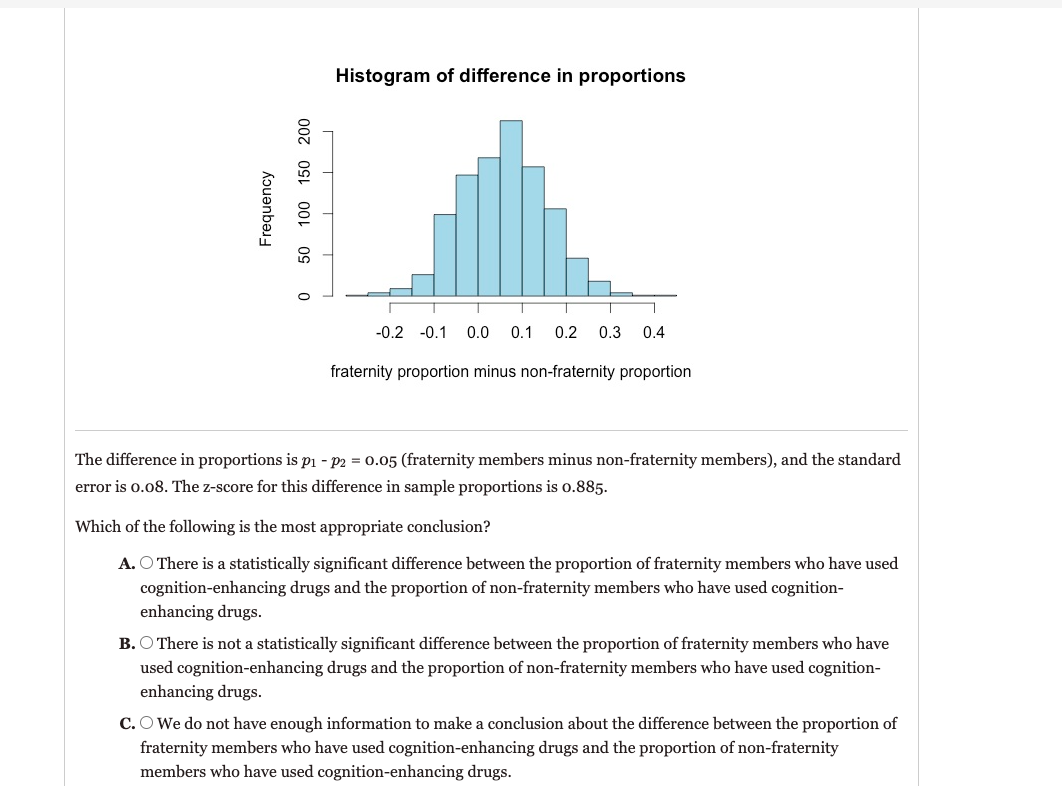
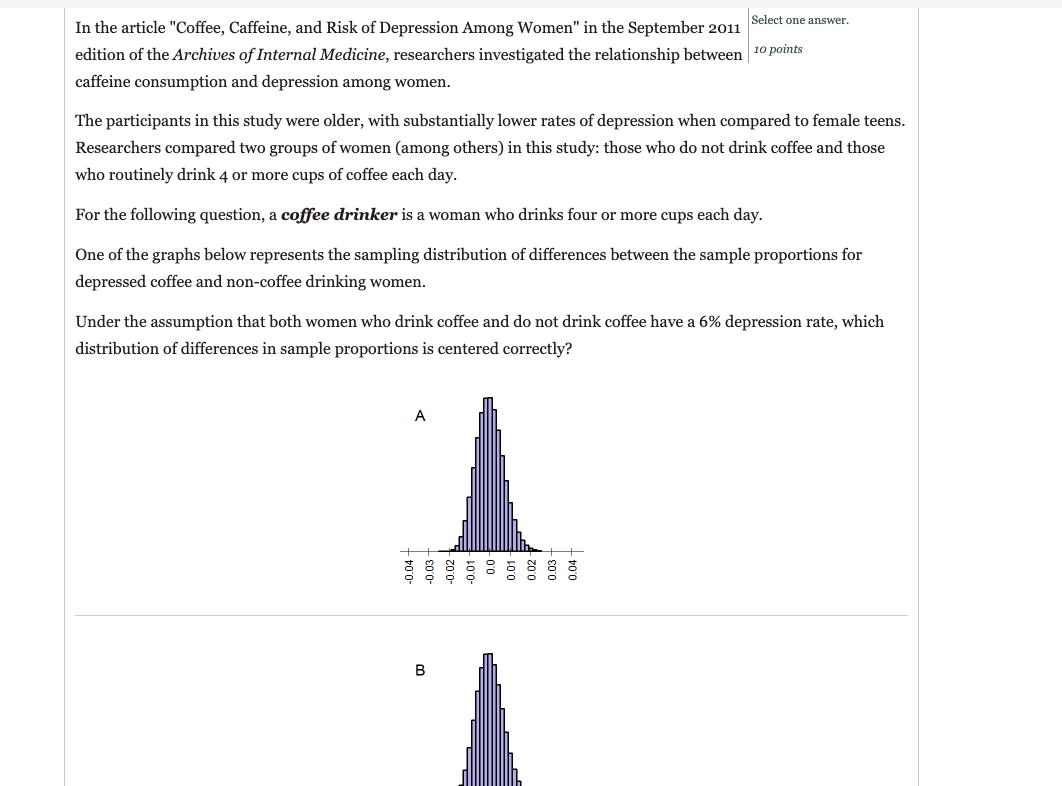
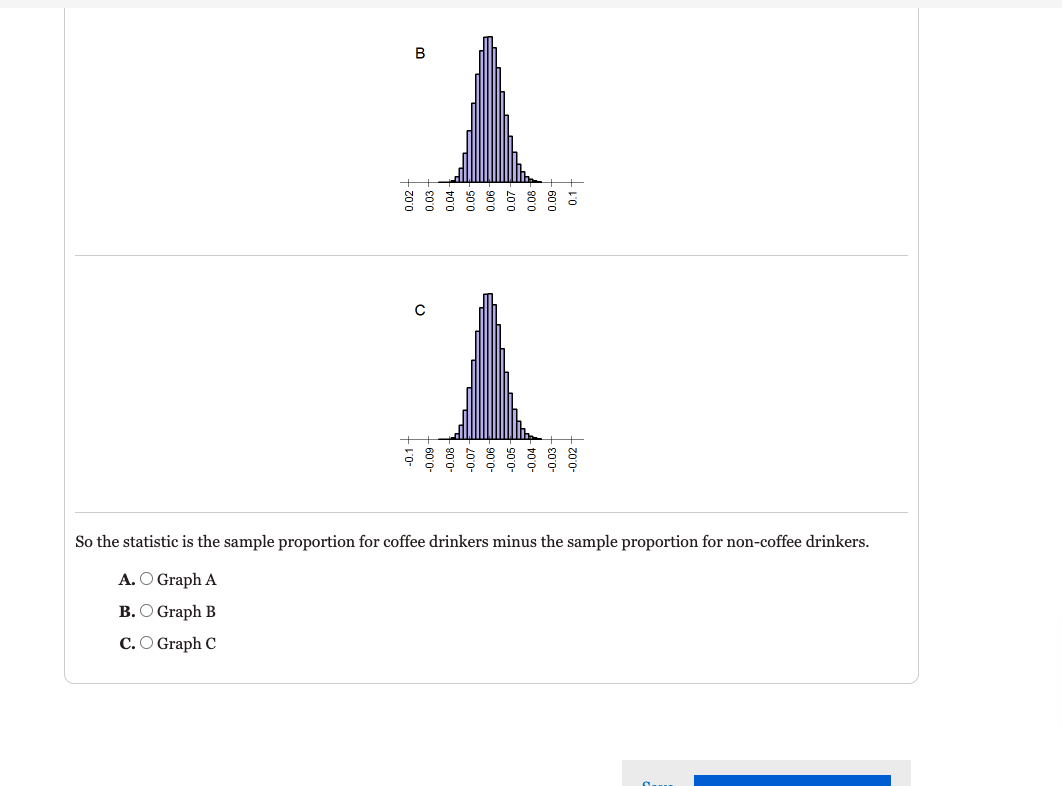
Skittles: The popular Skittles candy comes in 5 colors. According to the Skittles website, the Select one answer. colors are evenly distributed in the population of Skittle candies. So each color makes up 20% 10 points of the population. Suppose that we buy 2 small bags of Skittles. We determine the percentage of green Skittles in one bag and the percentage of orange Skittles in the other bag. Suppose that each bag contains 40 candies. We define the difference in sample proportions as "green" minus "orange." Which of the following will give a sample difference of 0.10? A. O 10 green and 6 orange B. O 4 green and 8 orange C. O 10 green and 10 orange Question 5 In a study at West Virginia University Hospital, researchers investigated smoking behavior of Type numbers in the boxes. cancer patients to create a program to help patients stop smoking. They published the results 10 points in Smoking Behaviors Among Cancer Survivors (January 2018, Journal of Oncology Practice). In this study, the researchers sent a 22-item survey to 1152 cancer patients. They collected demographic information (age, sex, ethnicity, zip code, level of education), clinical and smoking history, and information about quitting smoking. Of the 1152 patients who were mailed surveys, 230 patients responded. For various reasons, researchers used only 207 of the completed surveys. 32 out of 115 female cancer patients reported being past smokers, and 56 out of 92 male cancer patients reported being past smokers. Calculate the difference between the corresponding sample proportions P1 - P2 (female minus male). Round the answer to 4 decimal places.In a stud}.r at West Virginia University Hospital, researchers investigated smoking behavior of Type numbers in me bom' cancer patients to create a program to help patients stop smelting. They published the results \"PM\" in Smoking BehaviorsArnong Cancer Survivors {January 2018, Journal of Oncolog y Practice). In this study, the researchers sent a 22-item survey to 1152 cancer patients. They collected demographic information (age, sex, ethnicity, zip code, level of education), clinical and smoking history, and information about quitting smoking. Ofthe 1152 patients who were mailed surveys, 230 patients responded. For various reasons, researchers used only 207 of the completed surveys. 32 out of 115 female cancer patients reported being past smokers, and 56 out of 92 male cancer patients reported being past smokers. Calculate the difference between the corresponding sample proportions 361 152 (female minus male}. Round the answer to 4 decimal places. E Question 6 In 2014, students in an advanced Statistics course at UC Berkeley conducted an anonymous Type numbers in the bom' survey about use of cognition-enhancing drugs among college males. One survey group of 1" Palm males included members from a fraternity, and the other survey group of males included no fraternity members. The standard error formula for the difference between sample proportions is _ plil-r1)+ rail-r2) [Iii-55 _ \"1 W2 Calculate the standard error for a survey comparing proportions of cognition-enhancing drug use of fraternity members to non-fraternity members, where 131 = 0.29, 11.1 = 130, p2 = 0.2, 714 = 93. Round all calculations to the thousandth decimal place. The graph below represents the sampling distribution of differences between the proportion of fraternity members who have used cognition-enhancing drugs and the proportion of non-fraternity members who have used oognition- enhancing drugs. The difference in proportions is 1.11 p3 = 0.05 (fraternity members minus non-fratemity members). Histogram of difference in proportions a o_ N 3.3.- 5 O LI. 8 a- llIllll -D.2 -D.1 {1.0 0.1 {1.2 0.3 {1.4 fraternity proportion minus non-fratemity proportion Consider simulating this data with 5000 samples from each of the fraternity member group and the non-fraternity member group. Based on the sampling distribution of difference in proportions, which of the following results for p1 p2 would be most unusual? A. O 0.0 B. O 43.06 C. O 0.29 D. O -o.1 Histogram of difference in proportions O ._ N 8_ 5'1 5 O LI. 8 .- lllllll -0.2 -0.1 {1.0 {1.1 {1.2 {1.3 {1.4 fraternity proportion minus non-fratemity proportion The difference in proportions is p1 - p2 = 0.05 [fraternity members minus non-fraternity members], and the standard error is 0.08. The z-score for this difference in sample proportions is 0.885. 'Which of the following is the most appropriate conclusion? A. 0 There is a statistically signicant difference between the proportion of fraternity members who have used cognition-enhancing drugs and the proportion of no n-fraternity members who have used cognition- enhancing drugs. B. 0 There is not a statistically signicant difference between the proportion of fraternity members who have used cognition-enhancing drugs and the proportion of non-fraternity members who have used cognition- enhancing drugs. C. Q We do not have enough information to make a conclusion about the difference between the proportion of fraternity members who have used cognition-enhancing drugs and the proportion of non-fraternity members who have used cognition-enhancing drugs. In the article "Coffee, Caffeine, and Risk of Depression Among Women" in the September 2011 Select one answer. edition of the Archives of Internal Medicine, researchers investigated the relationship between 10 points caffeine consumption and depression among women. The participants in this study were older, with substantially lower rates of depression when compared to female teens. Researchers compared two groups of women (among others) in this study: those who do not drink coffee and those who routinely drink 4 or more cups of coffee each day. For the following question, a coffee drinker is a woman who drinks four or more cups each day. One of the graphs below represents the sampling distribution of differences between the sample proportions for depressed coffee and non-coffee drinking women. Under the assumption that both women who drink coffee and do not drink coffee have a 6% depression rate, which distribution of differences in sample proportions is centered correctly? A -0.04+ 0.0 -0.03- 0.03 0.01 -0.01 0.04 0.02 -0.02 BA. O Graph A B. O Graph B C. O Graph C -0.1 + 0.02- B C -0.09 0.03 0.08 0.04 0.05 So the statistic is the sample proportion for coffee drinkers minus the sample proportion for non-coffee drinkers. -0.07 0.06 0.06 -0.05 0.07 -0.04 0.08 -0.03 0.09 -0.02