Answered step by step
Verified Expert Solution
Question
1 Approved Answer
slope Intercept -0.54265 53.425 Class example : This is 16 weeks of demand data. We want to understand the data. Is it seasonal? (Look at
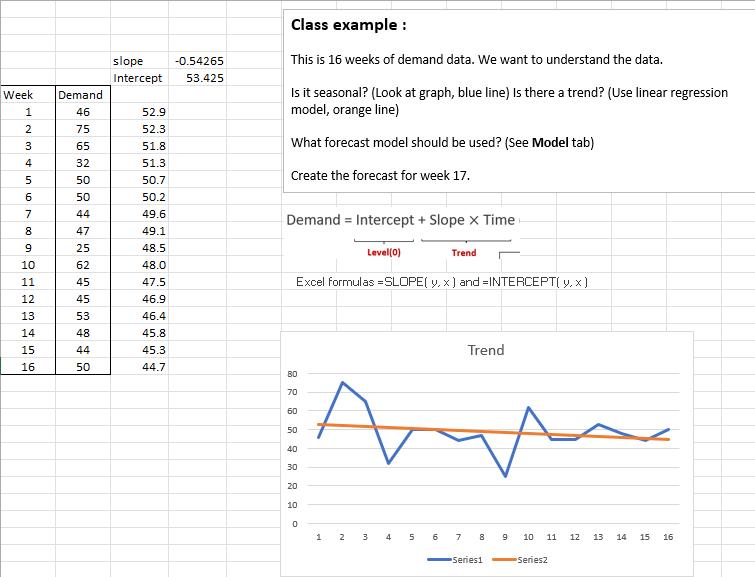
slope Intercept -0.54265 53.425 Class example : This is 16 weeks of demand data. We want to understand the data. Is it seasonal? (Look at graph, blue line) Is there a trend? (Use linear regression model, orange line) Demand 46 Week 1 2 3 What forecast model should be used? (See Model tab) 4 Create the forecast for week 17. Demand = Intercept + Slope x Time 75 65 32 50 50 44 47 25 62 45 45 53 48 44 50 52.9 52.3 51.8 51.3 50.7 50.2 49.6 49.1 48.5 48.0 47.5 46.9 46.4 45.8 45.3 44.7 5 6 7 8 9 10 11 12 13 14 15 16 Level(0) Trend Excel formulas =SLOPE Y. X ) and =INTERCEPTI Y.X) Trend 80 70 60 50 40 30 20 10 0 1 N 3 3 4 5 5 6 7 7 8 9 10 11 12 13 14 15 16 -Seriesi Series2 slope Intercept -0.54265 53.425 Class example : This is 16 weeks of demand data. We want to understand the data. Is it seasonal? (Look at graph, blue line) Is there a trend? (Use linear regression model, orange line) Demand 46 Week 1 2 3 What forecast model should be used? (See Model tab) 4 Create the forecast for week 17. Demand = Intercept + Slope x Time 75 65 32 50 50 44 47 25 62 45 45 53 48 44 50 52.9 52.3 51.8 51.3 50.7 50.2 49.6 49.1 48.5 48.0 47.5 46.9 46.4 45.8 45.3 44.7 5 6 7 8 9 10 11 12 13 14 15 16 Level(0) Trend Excel formulas =SLOPE Y. X ) and =INTERCEPTI Y.X) Trend 80 70 60 50 40 30 20 10 0 1 N 3 3 4 5 5 6 7 7 8 9 10 11 12 13 14 15 16 -Seriesi Series2
Step by Step Solution
There are 3 Steps involved in it
Step: 1
Get Instant Access to Expert-Tailored Solutions
See step-by-step solutions with expert insights and AI powered tools for academic success
Step: 2
Step: 3
Ace Your Homework with AI
Get the answers you need in no time with our AI-driven, step-by-step assistance
Get Started