Answered step by step
Verified Expert Solution
Link Copied!

Question

1 Approved Answer

Small effect sizes can make a big difference ~ Suppose a test is used to select applicants for a job advancement program. Assume that there

Small effect sizes can make a big difference ~ Suppose a test is used to select applicants for a job advancement program.

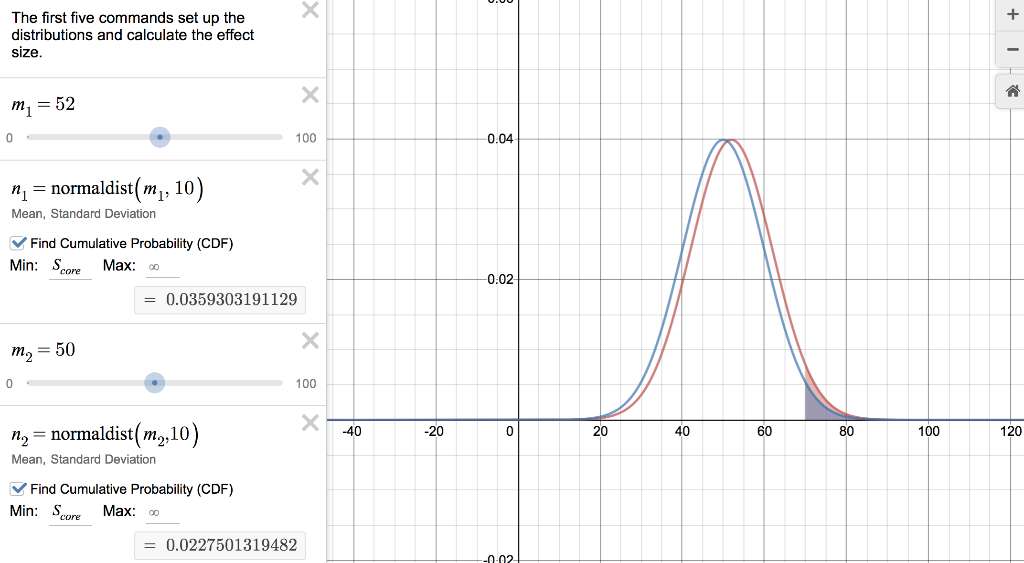
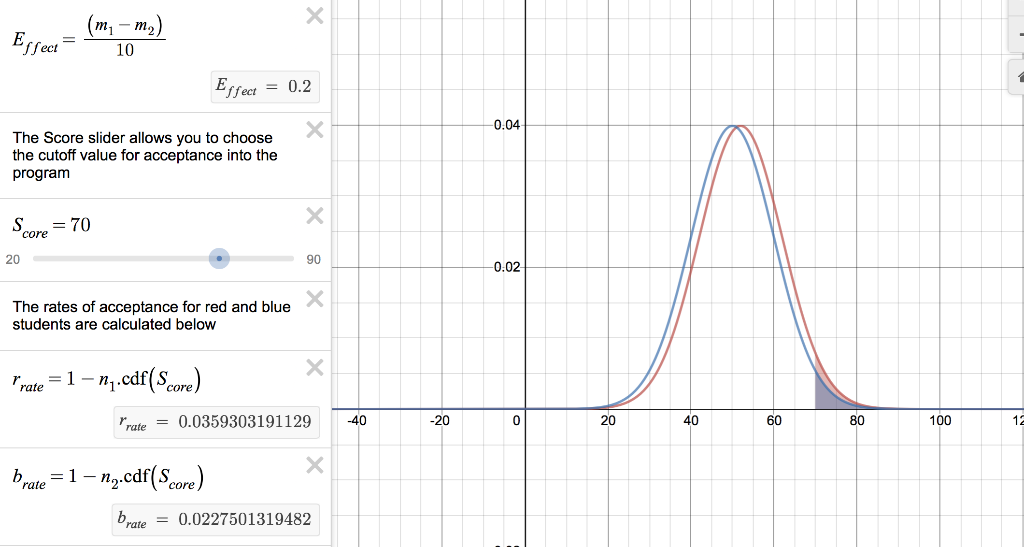
Assume that there are two types of applicants (red and blue) and that the mean for the red applicants is 52, the mean for the blue applicants is 50, both distributions are nearly normal, and the standard deviation for each distribution is 10. The difference in means (that is, the effect size) is therefore only 0.2 standard deviations and the effect of being either red or blue would be considered small, not visible to the naked eye.

At one large company there are two programs that use this test to screen applicants.

Program 1 is less selective. Managers use a cutoff value of 40 for this program, meaning that any applicant who scores higher than 40 is accepted into the program.

Program 2 is very selective. Managers use a cutoff value of 70 for Program 2, meaning that only applicants who score higher than 70 are accepted into the program.

Task 1

You can use this Desmos graph page to help you answer questions 1-4 and question 7. Write a paragraph or two that summarizes your findings and explains your recommendation to the program managers.

  1. If 500 red applicants and 500 blue applicants apply for Program 1, how many red applicants are accepted and how many blue applicants are accepted?
  2. What proportion of the total number of accepted applicants are red? What proportion are blue?
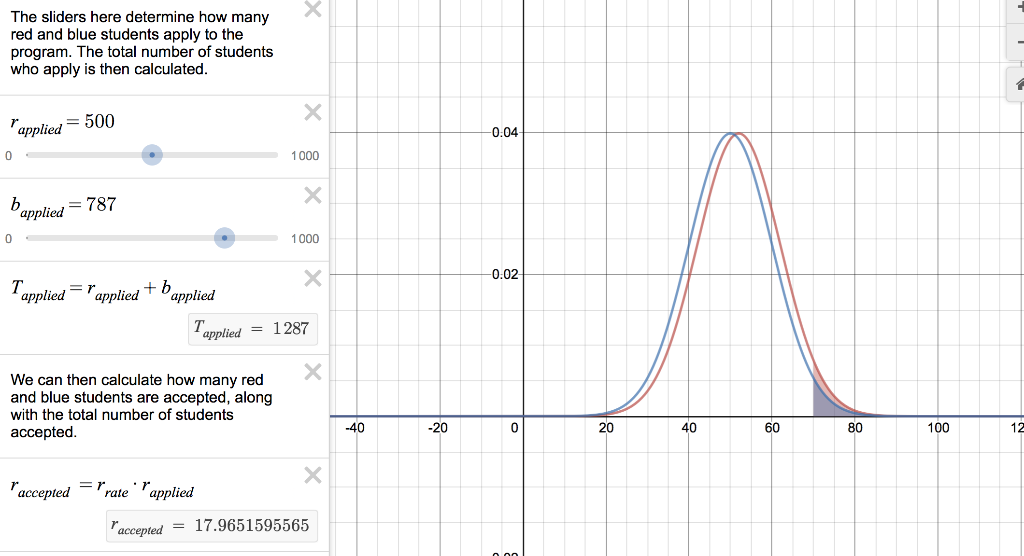
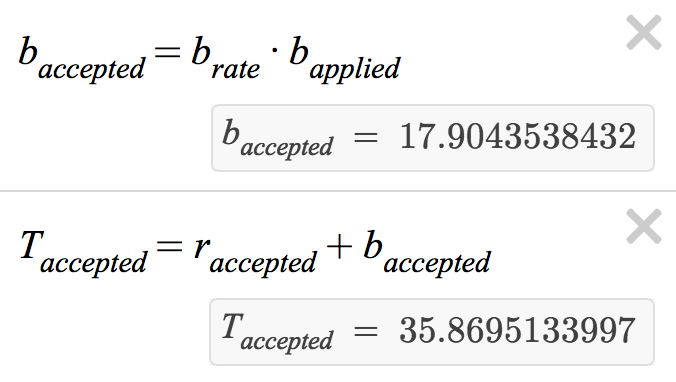
  3. If 500 red applicants and 500 blue applicants apply for Program 2, how many red applicants are accepted and how many blue applicants are accepted?
  4. What proportion of the total number of accepted applicants are red? What proportion are blue?
  5. Do you think this test appears to unfairly privilege red applicants over blue applicants for Program 1?
  6. Do you think this test appears to unfairly privilege red applicants over blue applicants for Program 2?
  7. Suppose managers wanted to have equal proportion of red and blue applicants accepted into their programs. Experiment by changing the number of applicants for each group to see what it would take to achieve equal proportions, then make a recommendation to the program leaders about using this test to screen applicants.image text in transcribedimage text in transcribedimage text in transcribedimage text in transcribed
0.00 + The first five commands set up the distributions and calculate the effect size. x A m = 52 0 100 0.04 19 Mean, Standard Deviation Find Cumulative Probability (CDF) Min: Score Max: 00 0:02 = 0.0359303191129 > m2 = 50 0 100 ng = normaldist(m2,10) -40 -20 0 20 40 60 80 100 120 Mean, Standard Deviation Find Cumulative Probability (CDF) Min: Score Max: 00 0.0227501319482 -0-02 (m, -m,) Es sect= 10 Effect = 0.2 0.04 The Score slider allows you to choose the cutoff value for acceptance into the program X S core = 70 20 90 -0.02 X The rates of acceptance for red and blue students are calculated below x Prate = 1 n;.cdf (Score) Prate = 0.0359303191129 -40 -20 0 20 40 60 80 100 12 x = 1- rate -ny.cdf(Score) brate = 0.0227501319482 x The sliders here determine how many red and blue students apply to the program. The total number of students who apply is then calculated. x "applied = 500 -0.04 0 1000 b applied = 787 0 1000 X -0.02 T. applied =r applied + b applied T'applied = 1287 x We can then calculate how many red and blue students are accepted, along with the total number of students accepted. -40 -20 0 20 40 60 80 100 12 "accepted =rate ir 'applied "accepted = 17.9651595565 X b 'accepted = b Prate: 6 applied baccepted 17.9043538432 X . accepted + b accepted = l'accepted Taccepted = 35.8695133997 0.00 + The first five commands set up the distributions and calculate the effect size. x A m = 52 0 100 0.04 19 Mean, Standard Deviation Find Cumulative Probability (CDF) Min: Score Max: 00 0:02 = 0.0359303191129 > m2 = 50 0 100 ng = normaldist(m2,10) -40 -20 0 20 40 60 80 100 120 Mean, Standard Deviation Find Cumulative Probability (CDF) Min: Score Max: 00 0.0227501319482 -0-02 (m, -m,) Es sect= 10 Effect = 0.2 0.04 The Score slider allows you to choose the cutoff value for acceptance into the program X S core = 70 20 90 -0.02 X The rates of acceptance for red and blue students are calculated below x Prate = 1 n;.cdf (Score) Prate = 0.0359303191129 -40 -20 0 20 40 60 80 100 12 x = 1- rate -ny.cdf(Score) brate = 0.0227501319482 x The sliders here determine how many red and blue students apply to the program. The total number of students who apply is then calculated. x "applied = 500 -0.04 0 1000 b applied = 787 0 1000 X -0.02 T. applied =r applied + b applied T'applied = 1287 x We can then calculate how many red and blue students are accepted, along with the total number of students accepted. -40 -20 0 20 40 60 80 100 12 "accepted =rate ir 'applied "accepted = 17.9651595565 X b 'accepted = b Prate: 6 applied baccepted 17.9043538432 X . accepted + b accepted = l'accepted Taccepted = 35.8695133997

Step by Step Solution

There are 3 Steps involved in it

Step: 1

blur-text-image

Get Instant Access to Expert-Tailored Solutions

See step-by-step solutions with expert insights and AI powered tools for academic success

Step: 2

blur-text-image

Step: 3

blur-text-image

Ace Your Homework with AI

Get the answers you need in no time with our AI-driven, step-by-step assistance

Get Started

Students also viewed these Accounting questions

Question

Understanding Group Leadership Culture and Group Leadership

Answered: 1 week ago