

Question
Smith Enterprises Comparative Income Statement For the Years Ended December 31, 2015 and 2014 12/31/2015 12/31/2014 Sales $ 600,000 $ 500,000 Cost of Goods Sold
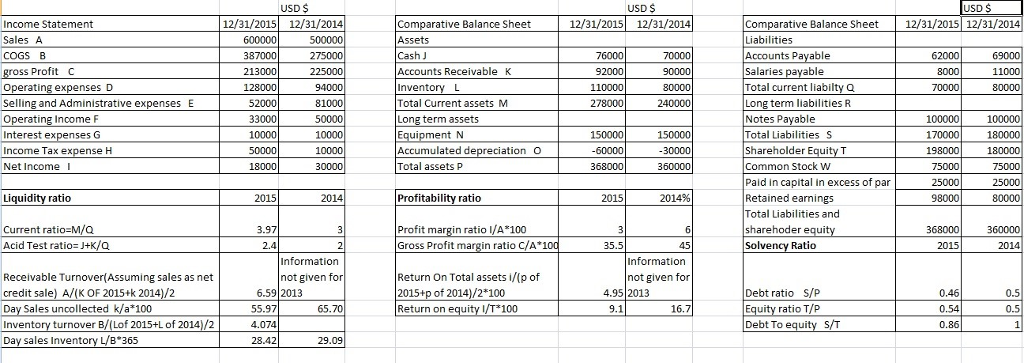
Smith Enterprises Comparative Income Statement For the Years Ended December 31, 2015 and 2014 12/31/2015 12/31/2014 Sales $ 600,000 $ 500,000 Cost of Goods Sold 387,000 275,000 Gross Profit 213,000 225,000 Expenses Operating Expenses 128,000 94,000 Selling & Administrative Expenses 52,000 81,000 Operating Income 33,000 50,000 Interest Expense 10,000 10,000 Income Tax Expense 5,000 10,000 Net Income $ 18,000 $ 30,000 Smith Enterprises Comparative Balance Sheet December 31, 2015 and 2014 Assets: Current assets Cash $ 76,000 $ 70,000 Accounts Receivable 92,000 90,000 Inventory 110,000 80,000 Total Current Assets 278,000 240,000 Long-term assets Equipment 150,000 150,000 Accumulated Depreciation (60,000) (30,000) Total Assets $ 368,000 $ 360,000 Liabilities Current liabilities Accounts Payable $ 62,000 $ 69,000 Salaries Payable 8,000 11,000 Total Current Liabilities 70,000 80,000 Long-term liabilities Notes Payable 100,000 100,000 Total Liabilities 170,000 180,000 Shareholders' Equity Common Stock, $1 par 75,000 75,000 Paid in Capital in Excess of Par, Common Stock 25,000 25,000 Retained Earnings 98,000 80,000 Total Liabilities & Shareholders' Equity $ 368,000 $ 360,000
explain the following:
1. Vertical Analysis
2. Horizontal Analysis
3. Liquidity and Efficiency Financial Ratios
4. Solvency Financial Ratios
5. Profitability Financial Ratios
USD $ 12/31/2015 12/31/2014 12/31/2015 12/31/2014 Comparative Balance Sheet 12/31/2015 12/31/2014 Liabilities Accounts Payable Salaries pavable Total current liabilty a Long term liabilities R Notes Payable Total Liabilities S Shareholder Equity T Common Stock W Paid in capital in excess of par Retained earnings Total Liabilities and sharehoder equit Solvency Ratio Income Statement Sales A COGS B Comparative Balance Sheet Assets 275000 76000 92000 110000 278000 387000 62000 69000 s Profit C Accounts Receivablek Invento Total Current assets M Long term assets Equipment N Accumulated depreciation Total assets P 213000 8000 11000 0 ing expenses D 94000 80000 Selling and Administrative expenses E 240000 52000 33000 10000 81000 100000 170000 198000 100000 180000 180000 ing Income Interest ex Income Tax expense H Net Income 10000 10000 30000 150000 150000 18000 368000 360000 Liquidity ratio 2015 2014 Profitability ratio 2015 2014% 98000 Current ratio-M/O Acid Test ratio J+K/Q Profit margin ratio l/A 100 Gross Profit margin ratio C/A1 2015 2014 Information Information Receivable Turnover(Assuming sales as net credit sale) A/(K OF 2015+k 2014)/2 Day Sales uncollected k/a 100 Inventory turnover B/(Lof 2015+L of 2014)/2 Day sales Invento Return On Total assets i/(p of 2015+p of 20141/2 100 Return on equ not given not given for 6.59 2013 55.97 4.074 28.42 4.952013 Debt ratio S/P 65.70 ratio T/P 0.54 Debt To equity ST ??5 29.09
Step by Step Solution
There are 3 Steps involved in it
Step: 1

Get Instant Access to Expert-Tailored Solutions
See step-by-step solutions with expert insights and AI powered tools for academic success
Step: 2

Step: 3
Ace Your Homework with AI
Get the answers you need in no time with our AI-driven, step-by-step assistance
Get Started
Mastering Management System Auditing The Essential Guide To Effective Auditing Practices
Authors: Ashar Hasan
1st Edition
B0C47RGBVM, 979-8393399023