Answered step by step
Verified Expert Solution
Question
1 Approved Answer
So I have to create a plot with these criteria: I'm in Google Collab and here is my code for it so far: As you
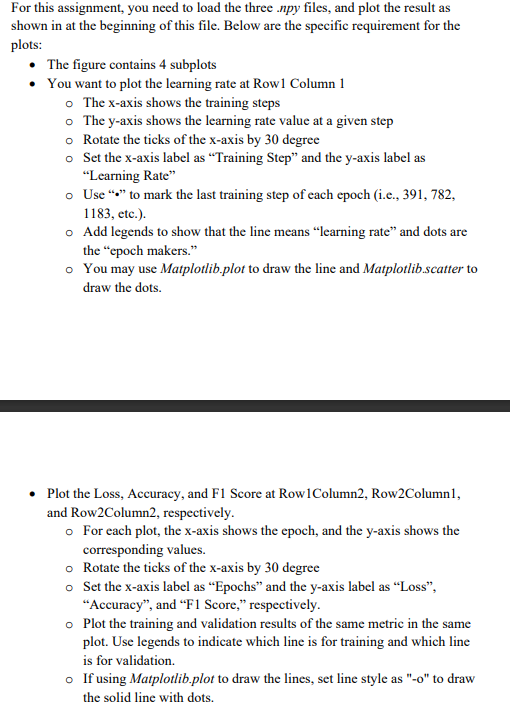
So I have to create a plot with these criteria:

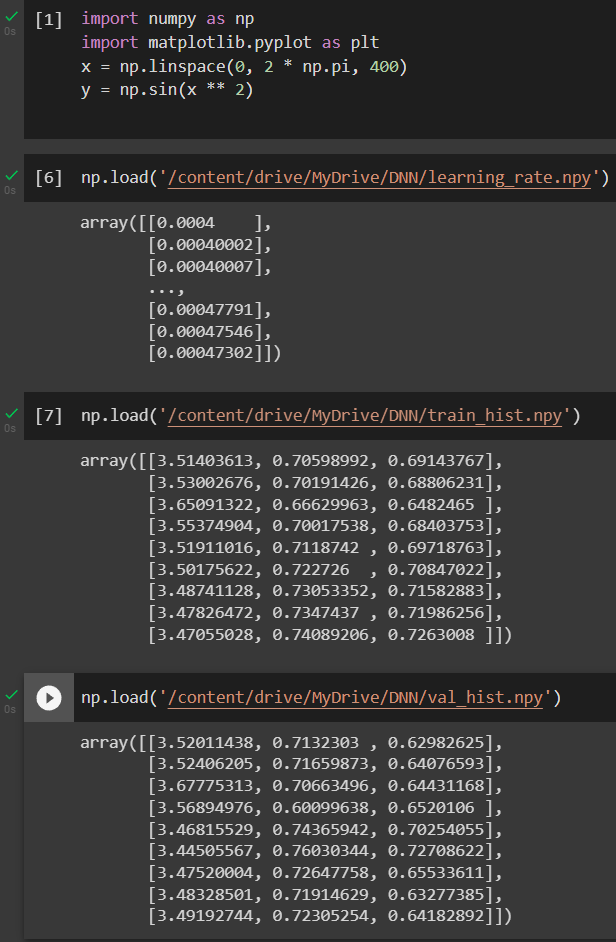
I'm in Google Collab and here is my code for it so far:

As you can see I can load the arrays just fine but I'm having trouble setting up the array with the specific guidelines. Any help would be appreciated, thank you!
For this assignment, you need to load the three .npy files, and plot the result as shown in at the beginning of this file. Below are the specific requirement for the plots: - The figure contains 4 subplots - You want to plot the learning rate at Row1 Column 1 The x-axis shows the training steps The y-axis shows the learning rate value at a given step Rotate the ticks of the x-axis by 30 degree Set the x-axis label as "Training Step" and the y-axis label as "Learning Rate" Use "e" to mark the last training step of each epoch (i.e., 391, 782, 1183, etc.). Add legends to show that the line means "learning rate" and dots are the "epoch makers." You may use Matplotlib.plot to draw the line and Matplotlib.scatter to draw the dots. - Plot the Loss, Accuracy, and F1 Score at Row1Column2, Row2Column1, and Row2Column2, respectively. For each plot, the x-axis shows the epoch, and the y-axis shows the corresponding values. Rotate the ticks of the x-axis by 30 degree Set the x-axis label as "Epochs" and the y-axis label as "Loss", "Accuracy", and "F1 Score," respectively. Plot the training and validation results of the same metric in the same plot. Use legends to indicate which line is for training and which line is for validation. If using Matplotlib.plot to draw the lines, set line style as "-o" to draw the solid line with dots. importmatplotlib.pyplotaspltx=nplinspace(0,2nppi,400)y=npsin(x2) [6] np.load('/content/drive/MyDrive/DNN/learning_rate.npy ') array[[0.0004],[0.00040002],[0.00040007],,[0.00047791],[0.00047546],[0.00047302]]) [7] np.load(' /content/drive/MyDrive/DNN/train_hist.npy ' ) array[[3.51403613,0.70598992,0.69143767],[3.53002676,0.70191426,0.68806231],[3.65091322,0.66629963,0.6482465],[3.55374904,0.70017538,0.68403753],[3.51911016,0.7118742,0.69718763],[3.50175622,0.722726,0.70847022],[3.48741128,0.73053352,0.71582883],[3.47826472,0.7347437,0.71986256],[3.47055028,0.74089206,0.7263008]]) np.load ('/content/drive/MyDrive/DNN/val_hist.npy' ) arcray([3.52011438,0.7132303,0.62982625],[3.52406205,0.71659873,0.64076593],[3.67775313,0.70663496,0.64431168],[3.56894976,0.60099638,0.6520106],[3.46815529,0.74365942,0.70254055],[3.44505567,0.76030344,0.72708622],[3.47520004,0.72647758,0.65533611],[3.48328501,0.71914629,0.63277385],[3.49192744,0.72305254,0.64182892]])Step by Step Solution
There are 3 Steps involved in it
Step: 1

Get Instant Access to Expert-Tailored Solutions
See step-by-step solutions with expert insights and AI powered tools for academic success
Step: 2

Step: 3

Ace Your Homework with AI
Get the answers you need in no time with our AI-driven, step-by-step assistance
Get Started


