Answered step by step
Verified Expert Solution
Question
1 Approved Answer
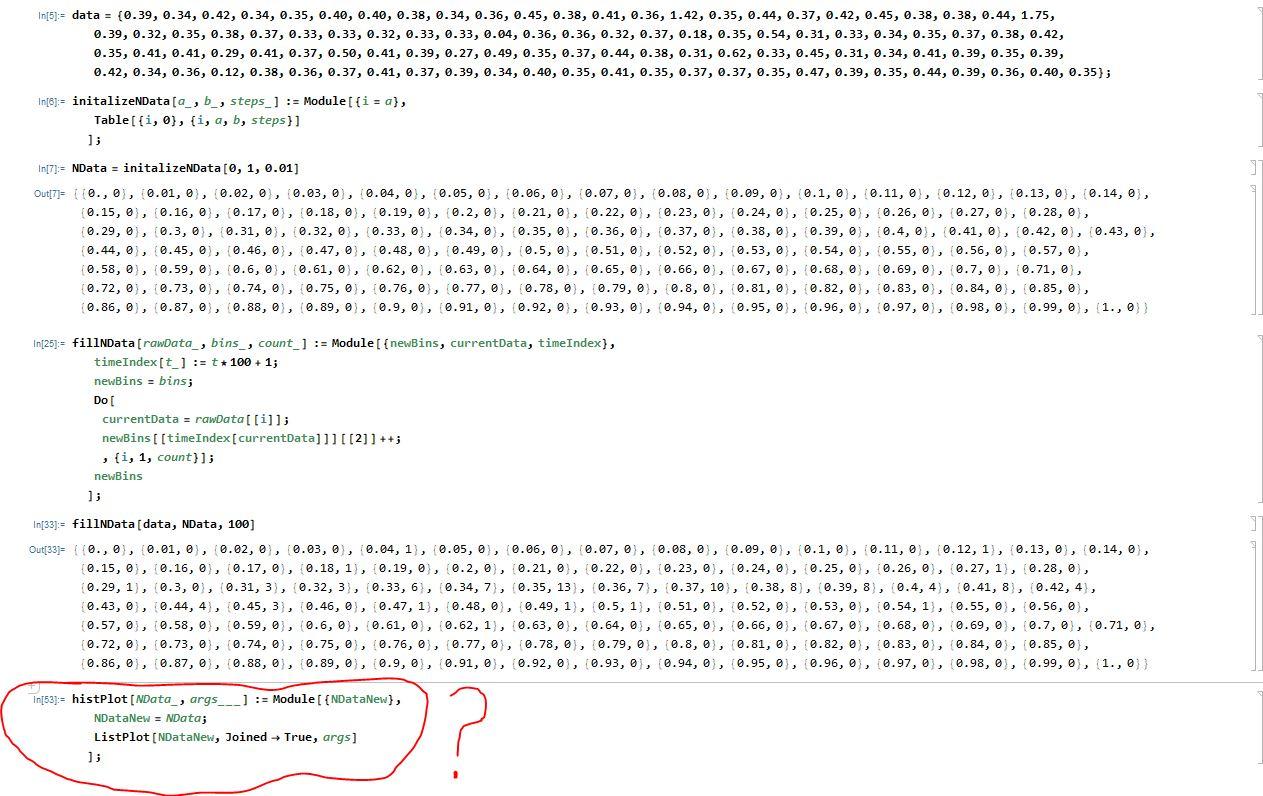
So I need to make a Histogram of my reaction times using ListPlot in Mathematica. I can not figure out how to do it like
So I need to make a Histogram of my reaction times using ListPlot in Mathematica. I can not figure out how to do it like how it is asking me to. The screenshot is the code I have and at the bottom is circled what I need. Any assistance would be great.
The question:

My code thus far:

This function will make a new copy of nD, suppose it is called NDataNew. For each point in NDataNew, the function should insert a new element of the list after this point and before the next point. The new point should have the time of the next element but the number of occurences of the previous point. For example, suppose we are at the point {0.30,7) in {...,{0.30,7},{0.31,13},...} This function should insert a new element {0.31,7) in between these two so that we have {...,{0.30,7},{0.31,7},{0.31,13),...} In[5]:= data = (0.39, 0.34, 0.42, 0.34, 0.35, 0.40, 0.40, 0.38, 0.34, 0.36, 0.45, 0.38, 0.41, 0.36, 1.42, 0.35, 0.44, 0.37, 0.42, 0.45, 0.38, 0.38, 0.44, 1.75, 0.39, 0.32, 0.35, 0.38, 0.37, 0.33, 0.33, 0.32, 0.33, 0.33, 0.94, 0.36, 0.36, 0.32, 0.37, 0.18, 0.35, 0.54, 0.31, 0.33, 0.34, 0.35, 0.37, 0.38, 0.42, 0.35, 0.41, 0.41, 0.29, 0.41, 0.37, 0.50, 0.41, 0.39, 0.27, 0.49, 0.35, 0.37, 0.44, 0.38, 0.31, 0.62, 0.33, 0.45, 0.31, 0.34, 0.41, 0.39, 0.35, 0.39, 0.42, 0.34, 0.36, 0.12, 0.38, 0.36, 0.37, 0.41, 0.37, 0.39, 0.34, 0.40, 0.35, 0.41, 0.35, 0.37, 0.37, 0.35, 0.47, 0.39, 0.35, 0.44, 0.39, 0.36, 0.40, 0.35); In[6]:= initalizeNData(a_,_, steps_] := Module (i = a}, Table[{i, 0}, {i, a, b, steps } ] ]; In[7):= NData = initalizeNData[0, 1, 0.01] Out[7= (10., 0, 0.01, 0), (0.62, 0, 0.03, , 0.04, 0, 0.05, 0, 0.06,0), (0.07, ), (0.08, 0, 0.09, 0, 0.1, 0, 0.11, 0), (0.12,0,0.13,0), (0.14, 0), (0.15, 0, 0.16, 0, 0.17, 0, 0.18, 0, 0.19, 0, 0.2, 0, 0.21, 0, 0.22, 0, 0.23, 0, 0.24, 0), (0.25, 0, 0.26,0), (0.27, 0, 0.28,0), (0.29, 0, 0.3, 0, 0.31,0), (0.32,0), (0.33, 0, 0.34, 0), 0.35, 0), (0.36,0), (0.37, 0, 0.38, 0, 0.39,0), (0.4, 0, 0.41, 0), (0.42,0), (0.43,0), 0.44, 0, 0.45, 0), (0.46,0), (0.47, 0, 0.48, 0, 0.49, 0), (0.5, 0, 0.51, 0, 0.52, 0), (0.53,0), (0.54, 0, 0.55, 0, 0.56,0, (0.57, 0), (0.58, 0, 0.59, 0, 0.6, 0, 0.61, 0), 0.62, 0, 0.63, 0, 0.64, 0), (0.65, 0, 0.66, 0, 0.67, 0, 0.68, 0, 0.69, 0, 0.7, 0, 0.71, 0), (0.72, 0, 0.73, 0), (0.74, 0), (0.75, 0), (0.76, 0), (0.77, ), (0.78, 0), (0.79, 0), (0.8,0), (0.81, 0), (0.82, 0), (0.83, , 0.84, 0), (0.85,0), 0.86, 0), (0.87, 0, 0.88, 0), (0.89, 0, 0.9, 0, 0.91, 0, 0.92, 0, 0.93, 0, 0.94, 0, 0.95,0), (0.96, 0, 0.97, 0, 0.98, 0, 0.99, 0, 1., 0) in[25]:= fillNData(rawData , bins, count] := Module (newBins, currentData, timeIndex}, timeIndex[t] := t +100 + 1; newBins = bins; Do [ currentData = rawData[[i]); newBins [[time Index [currentData]]][[2]] ++; , (i, 1, count}); newBins 1; In[33]:= fillNData (data, NData, 100) Out[33]= (10., 0), (0.01, 0, 0.02, 0), (0.03, 0, 0.94, 1), (0.05, 0), (0.06, 0), (0.07, 0, 0.08, 0, 0.09, 0, 0.1, 0), (0.11, 0), (0.12, 1), (0.13, 0), (0.14, 0), 0.15, 0, 0.16, 0, 0.17, 0, 0.18, 1), (0.19, 0), (0.2, 0), (0.21, 0, 0.22, 0), (0.23, 0, 0.24, 0), (0.25, 0), (0.26, 0), (0.27, 1), (0.28, 0), 0.29, 1), (0.3, 0), (0.31, 3), (0.32,3), 0.33, 6), 0.34, 7), (0.35, 13), (0.36, 7), (0.37, 10), (0.38, 8), 0.39, 8), 0.4,4), 0.41, 8), 0.42, 4); (0.43, 0, 0.44, 4), 0.45,3), (0.46,0), (0.47, 1), (0.48, 0), 0.49, 1), (0.5, 1), (0.51, 0, 0.52, 0, 0.53,0), (0.54, 1), (0.55, 0, 0.56,0, 0.57, 0, 0.58, 0), (0.59, 0, 0.6, 0), (0.61, 0), (0.62, 1), 0.63, 0, 0.64, 0, 0.65,0), (0.66, 0), (0.67, 0, 0.68, 0), (0.69, 0, 0.7,0), 0.71, 0), (0.72, 0), (0.73,0), (0.74, 0), (0.75, 0), (0.76, 0), (0.77, 0, 0.78,0), (0.79, 0, 0.8, 0), (0.81, 0), (0.82, 0), (0.83, 0, 0.84, 0, 0.85,0), (0.86, 0, 0.87, 0, 0.88,0), 0.89, 0, 0.9,0), 0.91, 0, 0.92, 0), 0.93, 0, 0.94, 0, 0.95, 0, 0.96, 0, 0.97, 0, 0.98, 0), 0.99, 0, 1., 0); In[53]:= histPlot [NData, args__] := Module (NDataNew}, NDataNew = NData; ListPlot (NDataNew, Joined True, args] ]
Step by Step Solution
There are 3 Steps involved in it
Step: 1

Get Instant Access to Expert-Tailored Solutions
See step-by-step solutions with expert insights and AI powered tools for academic success
Step: 2

Step: 3

Ace Your Homework with AI
Get the answers you need in no time with our AI-driven, step-by-step assistance
Get Started


