Question
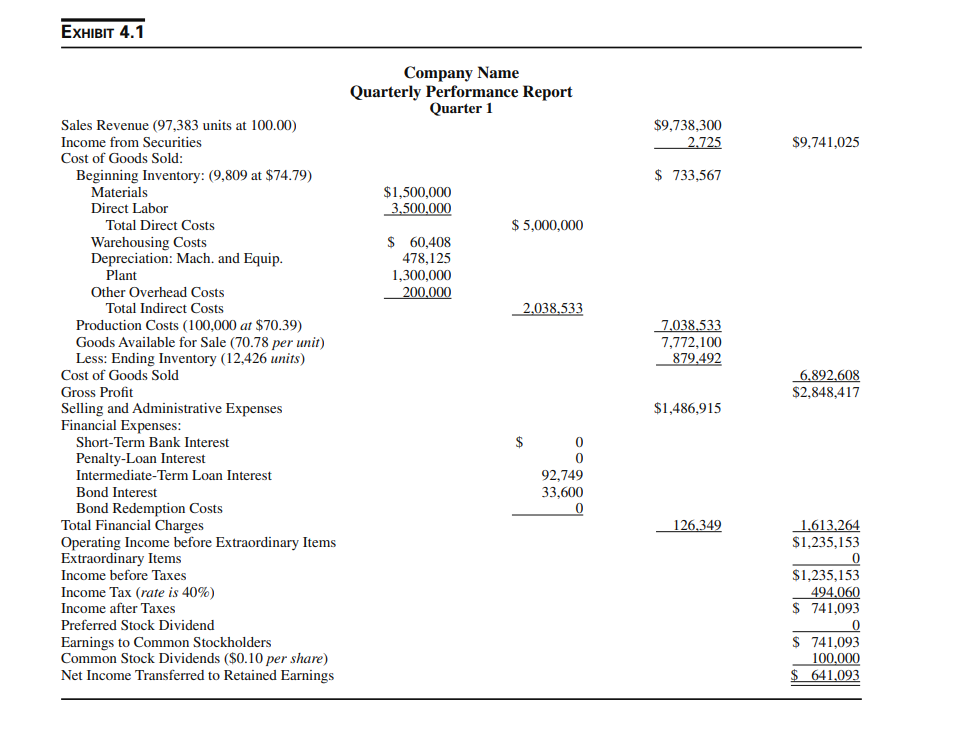
So, suppose we begin with the default conditions for Quarter #1 (in the manual). We might want to know what to expect for Quarter #2.
 So, suppose we begin with the default conditions for Quarter #1 (in the manual). We might want to know what to expect for Quarter #2. So, assume (your inputs) as follows: What would we expect the outputs for Quarter #2 to be?
Pro Forma Decision Inputs for Quarter Number 2
Units Demanded 103,000
Short-term investment rate 1% per quarter
Short-term loans rate 1.5% per quarter
Two-year loans rate 2% per quarter
Three year loan rate 2.5% per quarter
Long-term loan rate 3% per quarter
Preferred stock yield 3.5% per quarter
Capital gains rate NA
Company Operating Decisions: Pro Forma
Units to be produced 98,000
Per unit price $101
Div. per common share $0.15
Advertising cost 0
Demand/price forecast 0
Sales discount 0
Investment Decisions: Pro Forma
Short-term investment$2,500,000
Risk of S-T investment 0
Machine units bought 0
Units of plant bought 0
Project A no
Project B no
Financing Decisions: Pro Forma
Short-term loans 0
Preferred shares 0
Two-year loans $3,000,000
Common shares 0
Three-year loans 0
Common tender price 0
Ten-year bonds 0
Special Options: Pro Forma NA
Strike settlement (per hr.) NA
Dollar penalty NA
So what should we expect?
Please Fill in the blanks.This document will be sent as a Word file so you can add lines as needed. Include both a number and how you got it. For example, if we have sales of 103,000 units at a price of $101, we would expect $10,403,000 in sales because 103,000 times $101 is $10,403.000.Please fill in the blanks.
Pro Forma Performance Report
Quarter Number 2
Sales revenue ( 103,000 units at $101.00 ) $10,403,000 (unit sales * price)
Income from securities _____ (funds invested * interest rate)
Total revenue _____ ...
Cost of Goods Sold:
Beginning Inventory:
In units _____ ...
In cost per unit _____ ...
Value of _____ ...
Materials (costs) _____ ...
Direct Labor (costs) _____ ...
Total Direct Costs _____ ...
Warehousing Costs _____ ...
Depreciation: Mach. and Equip. _____ ...
Plant _____ ...
EXHIBIT4.1 Sales Revenue (97,383 units at 100.00) Income from Securities Cost of Goods Sold: Beginning Inventory: (9,809 at $74.79) Materials Direct Labor Total Direct Costs Warehousing Costs Depreciation: Mach. and Equip. Plant Other Overhead Costs Total Indirect Costs Production Costs (100,000 at $70.39) Goods Available for Sale (70.78 per unit) Less: Ending Inventory (12,426 units) Cost of Goods Sold Gross Profit Selling and Administrative Expenses Financial Expenses: Short-Term Bank Interest Penalty-Loan Interest Intermediate-Term Loan Interest Bond Interest Bond Redemption Costs Total Financial Charges Operating Income before Extraordinary Items Extraordinary Items Income before Taxes Income Tax (rate is 40% ) Income after Taxes Preferred Stock Dividend Earnings to Common Stockholders Common Stock Dividends (\$0.10 per share) Net Income Transferred to Retained Earnings Company Name Quarterly Performance Report Quarter 1 $9,738,300 $9,741,025 \$ 733,567 2,038,533 7,038.5337,772,100879,492 $2,848,4176,892,608 $0092,74933,6000 126.349 $1,235,1531,613,264 $1,235,153494,060$741,093 \begin{tabular}{rr} & 0 \\ \hline$741,093 \\ 100,000 \\ $641,093 \\ \hline \end{tabular} EXHIBIT4.1 Sales Revenue (97,383 units at 100.00) Income from Securities Cost of Goods Sold: Beginning Inventory: (9,809 at $74.79) Materials Direct Labor Total Direct Costs Warehousing Costs Depreciation: Mach. and Equip. Plant Other Overhead Costs Total Indirect Costs Production Costs (100,000 at $70.39) Goods Available for Sale (70.78 per unit) Less: Ending Inventory (12,426 units) Cost of Goods Sold Gross Profit Selling and Administrative Expenses Financial Expenses: Short-Term Bank Interest Penalty-Loan Interest Intermediate-Term Loan Interest Bond Interest Bond Redemption Costs Total Financial Charges Operating Income before Extraordinary Items Extraordinary Items Income before Taxes Income Tax (rate is 40% ) Income after Taxes Preferred Stock Dividend Earnings to Common Stockholders Common Stock Dividends (\$0.10 per share) Net Income Transferred to Retained Earnings Company Name Quarterly Performance Report Quarter 1 $9,738,300 $9,741,025 \$ 733,567 2,038,533 7,038.5337,772,100879,492 $2,848,4176,892,608 $0092,74933,6000 126.349 $1,235,1531,613,264 $1,235,153494,060$741,093 \begin{tabular}{rr} & 0 \\ \hline$741,093 \\ 100,000 \\ $641,093 \\ \hline \end{tabular}Step by Step Solution
There are 3 Steps involved in it
Step: 1

Get Instant Access to Expert-Tailored Solutions
See step-by-step solutions with expert insights and AI powered tools for academic success
Step: 2

Step: 3

Ace Your Homework with AI
Get the answers you need in no time with our AI-driven, step-by-step assistance
Get Started


