

Question
Social psychologists at the University of California at Berkeley wanted to study the effect that staring at drivers would have on driver behavior (Ellsworth, Carlsmith,
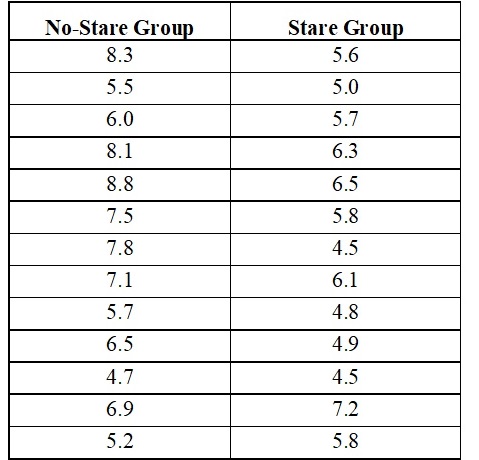
Social psychologists at the University of California at Berkeley wanted to study the effect that staring at drivers would have on driver behavior (Ellsworth, Carlsmith, and Henson, 1972). In a randomized experiment, the researchers either stared or did not stare at the drivers of automobiles stopped at a campus stop sign. The researchers timed how long it took each driver to proceed from the stop sign to a mark on the other side of the intersection. Suppose that the crossing times, in seconds, were as follows:
Step by Step Solution
There are 3 Steps involved in it
Step: 1

Get Instant Access to Expert-Tailored Solutions
See step-by-step solutions with expert insights and AI powered tools for academic success
Step: 2

Step: 3
Ace Your Homework with AI
Get the answers you need in no time with our AI-driven, step-by-step assistance
Get Started
Mathematics Concepts With Applications
Authors: Charles P McKeague
1st Edition
1630983136, 9781630983130