

Question: Solution A Solution B Kinetic Trial Deionized Water Buffer Starch 0.1 MH:0,*** 1 2 40 ml 3.0 ml 2.0 ml. 10 ml. 20 ml. 0.0
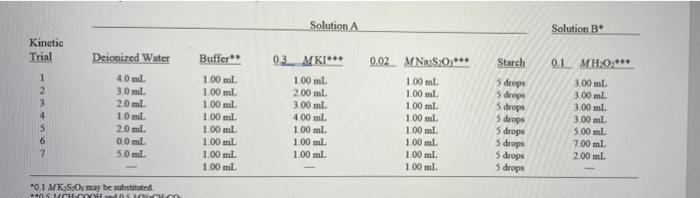
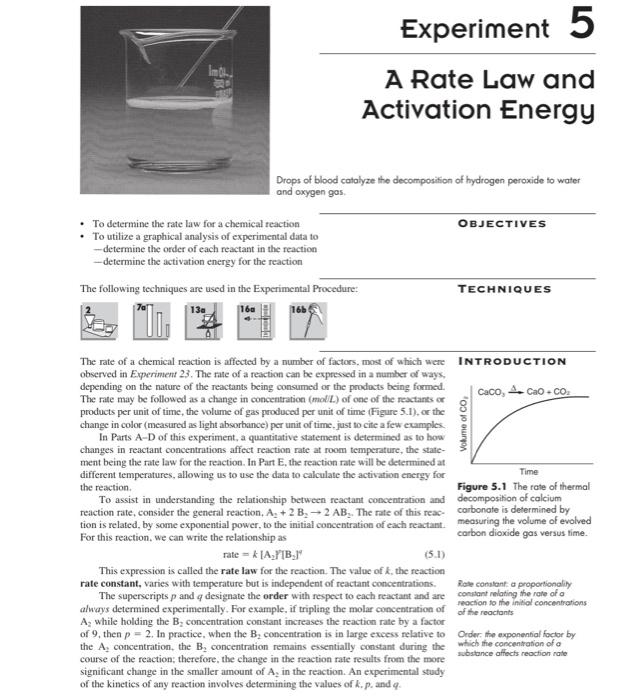
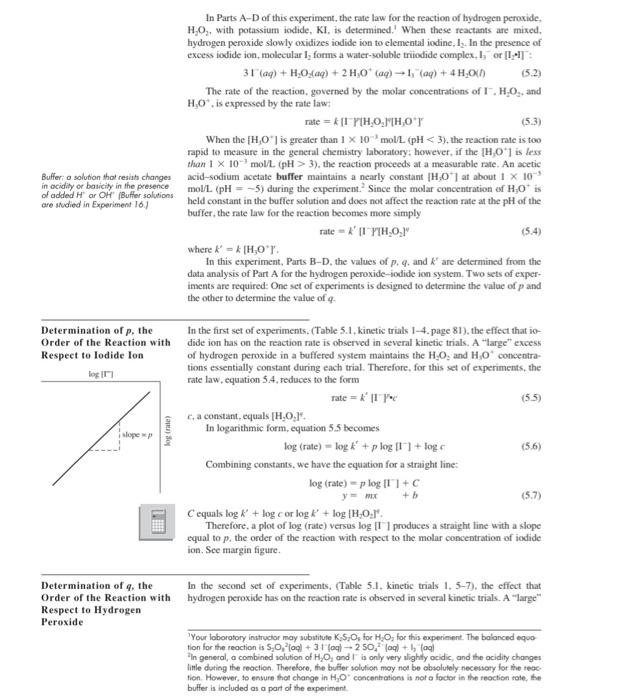
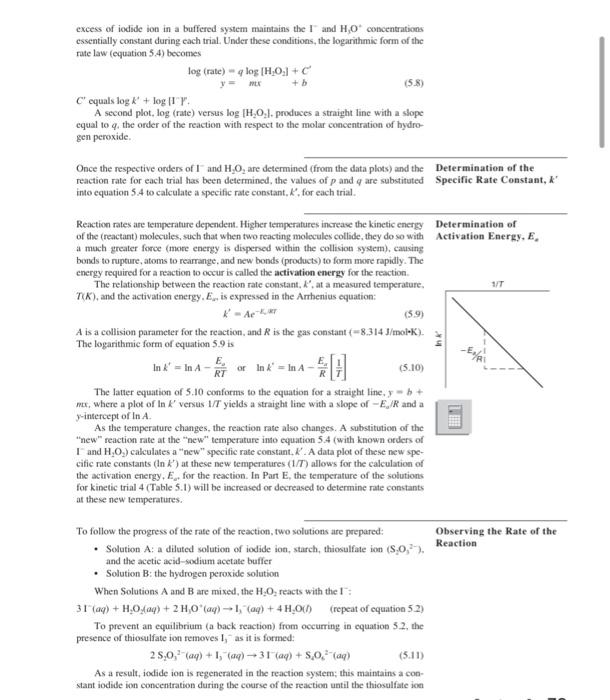
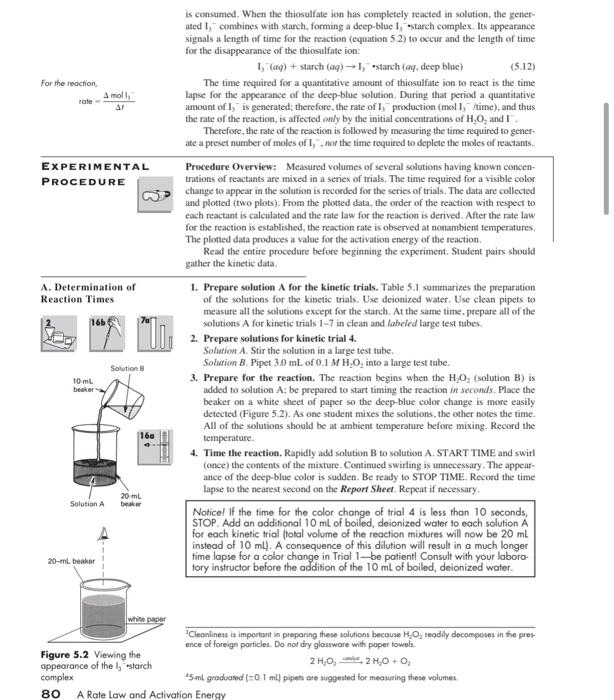
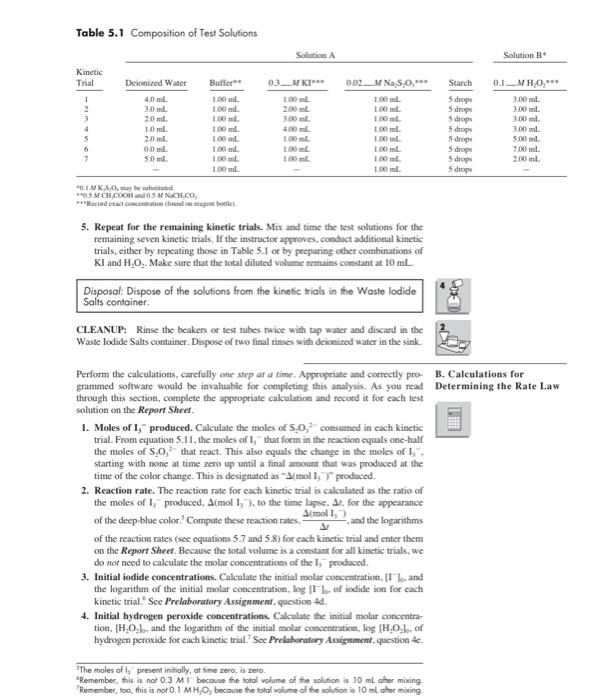
Solution A Solution B Kinetic Trial Deionized Water Buffer Starch 0.1 MH:0,*** 1 2 40 ml 3.0 ml 2.0 ml. 10 ml. 20 ml. 0.0 ml 5.0 ml 100 ml 100 ml 1.00 ml 100 ml 1.00 ml 1.00 ml. 100 ml 1.00 ml 0.3. MKI*** 100 ml. 2.00 ml. 3.00 ml. 400 ml 100 ml 1.00 mL 1.00 ml 0.02 M NMS:0,*** 100 ml 1.00 ml 1.00 ml 1.00 ml 1.00 mL 1.00 ml 1.00 ml. 100 ml 5 drops 5 droge 5 drops 5 drops 5 drops 5 drops 5 drops 5 drops 3.00 ml 3.00 ml 3.00 ml. 3.00 ml 5.00 ml 7.00 ml 2.00 mL 0.1 MKSO, may be substituted CASA b. Calculate the moles of S;0- that are consumed wing the one of the reaction in Trial 1. c. Calculate the moles of Is that are produced during the course of the reaction. See equation 5.1. d. Calculate the initial molar concentration of 1 (at time = 0). [1] (not 0.3 M, but after mixing solutions A and B for a total volume of 10 ml.). e. Calculate the initial molar concentration of H:02 (at time = 0), [H:01] (not 0.1 M, but after mixing solutions A and B for a total volume of 10 ml.). Imol. Experiment 5 A Rate Law and Activation Energy Drops of blood catalyze the decomposition of hydrogen peroxide to water and oxygen gas. OBJECTIVES To determine the rate law for a chemical reaction To utilize a graphical analysis of experimental data to --determine the order of each reactant in the reaction --determine the activation energy for the reaction The following techniques are used in the Experimental Procedure: TECHNIQUES 13 165 Volume of CO The rate of a chemical reaction is affected by a number of factors, most of which were INTRODUCTION observed in Experiment 23. The rate of a reaction can be expressed in a number of ways, depending on the nature of the reactants being consumed or the products being formed. The rate may be followed as a change in concentration (moll) of one of the reactants or Caco, Cao.co products per unit of time, the volume of gas produced per unit of time (Figure 5.1), or the 8 change in color (measured as light absorbance) per unit of time just to cite a few ecamples In Parts A-D of this experiment, a quantitative statement is determined as to how changes in reactant concentrations affect reaction rate at room temperature, the state- ment being the rate law for the reaction. In Part E, the reaction rate will be determined at Time different temperatures, allowing us to use the data to calculate the activation energy for the reaction Figure 5.1 The rate of thermal To assist in understanding the relationship between reactant concentration and decomposition of calcium reaction rate, consider the general reaction, A. +2 B. - 2 AB.. The rate of this reac- carbonate is determined by tion is related by some exponential power to the initial concentration of each reactant measuring the volume of evolved For this reaction, we can write the relationship as carbon dioxide gas versus time. rate = k1A,1B,19 (5.1) This expression is called the rate law for the reaction. The value of k. the reaction rate constant, varies with temperature but is independent of reactant concentrations Roate constante proportionality The superscripts p and a designate the order with respect to cach reactant and are constant relating the rate of a always determined experimentally. For example, if tripling the molar concentration of action to the initial concentrations of the reactants A while holding the B. concentration constant increases the reaction rate by a factor of 9, then p = 2. In practice, when the B, concentration is in large excess relative to Order, the exponential factor by the A, concentration, the B, concentration remains essentially constant during the which the concentration of a course of the reaction; therefore, the change in the reaction rate results from the more significant change in the smaller amount of A, in the reaction. An experimental study of the kinetics of any reaction involves determining the values of k.p. and 4 substance affects reaction rate + (5.2) In Parts A-D of this experiment, the rate law for the reaction of hydrogen peroxide, H.0, with potassium iodide, KI, is determined.' When these reactants are mixed. hydrogen peroxide slowly oxidizes iodide ion to elemental iodine, I. In the presence of excess iodide ion, molecular I, forms a water-soluble triiodide complex, I, or 12-13 31"(aq) + H20.402) + 2H,099) - I" (aq) + 4 H,000 The rate of the reaction, governed by the molar concentrations of 1.H.O., and H.0", is expressed by the rate law ratek [T PIH.O.MH0Y (5.3) When the [H,0") is greater than 1 x 10 mol/L (pH 3), the reaction proceeds at a measurable rate. An acetic acid-sodium acetate buffer maintains a nearly constant (1,01 at about 1 x 10 mol/L. (pH = -5) during the experiment. Since the molar concentration of H,0 is held constant in the buffer solution and does not affect the reaction rate at the pH of the buffer, the rate law for the reaction becomes more simply rate - *' PH.0.1 where k' - HOT In this experiment, Parts B-D. the values of p. 4, and k' are determined from the data analysis of Part A for the hydrogen peroxide-iodide ion system. Two sets of exper- iments are required: One set of experiments is designed to determine the value of p and the other to determine the value of 4 Buffer a solution that resist changes in acidity or basicity in the presence of added or OH Buffer solutions are studied in Experiment 161 Determination of p, the Order of the Reaction with Respect to lodide lon Log in fog rate) () slope In the first set of experiments. (Table 5.1, kinetic trials 1-4. page 81). the effect that io- dide ion has on the reaction rate is observed in several kinetic trials. A large excess of hydrogen peroxide in a buffered system maintains the H.O, and H0 concentra- tions essentially constant during each trial. Therefore, for this set of experiments, the rate law.cquation 54 reduces to the form rate=*' [1] (55) ca constant, equals [1.0.1 In logarithmic form, equation 55 becomes log Crate) = log ** + p log 1] + logo (56) Combining constants, we have the equation for a straight line: log (rate) - plog II 1+ y- + b (57) Cequals log k + log cor logk' + log (1.0.1. Therefore, a plot of log (rate) versus log IT produces a straight line with a slope equal top, the order of the reaction with respect to the molar concentration of iodide ion. See margin figure. Determination of the Order of the Reaction with Respect to Hydrogen Peroxide In the second set of experiments. (Table 5.1. kinetic trials 1. 5-7), the effect that hydrogen peroxide has on the reaction rate is observed in several kinetic trials. A "large" Your laboratory instructor may substitute K 5,0, for H, O, for this experiment. The balanced equo tion for the reaction is 5.0, lol +31 (al-250, og blad in general, a combined solution of H, O, and is only very slightly acidic, and the acidity changes little during the reaction. Therefore, the buffer solution may not be absolutely necessary for the rece tion. However, to ensure that change in H0 concentrations is not a factor in the reaction tote, the buffer is included as a part of the experiment excess of iodide ion in a buffered system maintains the land HO concentrations essentially constant during cach trial. Under these conditions, the logarithmic form of the rate law (equation 54) becomes log (rate) - q log (1,0,1 + (5.8) C'equals log k' + logIT A second plot. log (rate) versus log H.O.. produces a straight line with a slope equal to 4, the order of the reaction with respect to the molar concentration of hydro gen peroxide REX Once the respective orders of land H,0, are determined (from the data plots) and the Determination of the reaction rate for each trial has been determined the values of p and q are substituted Specific Rate Constant, k' into equation 5.4 to calculate a specific rate constant, k", for each trial. Ink Reaction rates are temperature dependent. Higher temperatures increase the kinetic energy Determination of of the (reactant) molecules, such that when two reacting molecules collide, they do so with Activation Energy, E. a much greater force (more energy is dispersed within the collision system), causing bonds to rupture, atoms to rearrange, and new bonds (products) to form more rapidly. The energy required for a reaction to occur is called the activation energy for the reaction The relationship between the reaction rate constant, l' at a measured temperature, 1/T T(K), and the activation energy. E, is expressed in the Arrhenius equation: KA- (59) A is a collision parameter for the reaction, and R is the gas constant (8.314 J/molek). The logarithmic form of equation 5.9 is E Ink' = In A RT or Int' - In A (5.10) The latter equation of 5.10 conforms to the equation for a straight line, y + me, where a plot of In k' versus 1/T yields a straight line with a slope of -E/R and a y-intercept of In A As the temperature changes, the reaction rate also changes. A substitution of the "new" reaction rate at the "new" temperature into equation 5.4 (with known orders of and H,0.) calculates a "new" specific rate constant. K'. A data plot of these new spe- cific rate constants (Ink) at these new temperatures (1/7) allows for the calculation of the activation energy, E, for the reaction. In Part E, the temperature of the solutions for kinetic trial 4 (Table 5.1) will be increased or decreased to determine rate constants at these new temperatures. To follow the progress of the rate of the reaction, two solutions are prepared: Observing the Rate of the Solution A: a diluted solution of iodide son, starch, thiosulfate ion (5.0,-), Reaction and the acetic acid-sodium acetate buffer Solution B: the hydrogen peroxide solution When Solutions A and B are mixed, the H.O, reacts with the !" 317) + H2O Aq) + 2H,0 (ag) -1, (aq) + 4H2O() (repeat of equation 5.2) To prevent an equilibrium (a back reaction) from occurring in equation 3.2, the presence of thiosulfate ion removes I, as it is formed: 25,0,? a) + 1, faq) +31 am) + 50. a) (5.11) As a result, iodide ion is regenerated in the reaction system, this maintains a con stant iodide ion concentration during the course of the reaction until the thiosulfate in For the reaction rate A moli EXPERIMENTAL PROCEDURE A. Determination of Reaction Times is consumed. When the thiosulfate ion has completely reacted in solution, the gener- ated I, combines with starch, forming a deep blue I, starch complex. Its appearance signals a length of time for the reaction (equation 5 2) to occur and the length of time for the disappearance of the thiosulfate ion: 1, aq) + starch (aq)-1, "starch (aq, deep blue) (5.12) The time required for a quantitative amount of thiosulfate ion to react is the time lapse for the appearance of the deep blue solution. During that period a quantitative amount of I, is generated therefore, the rate of ls production (moll, time), and thus the rate of the reaction, is affected only by the initial concentrations of H., and I Therefore, the rate of the reaction is followed by measuring the time required to gener ate a preset number of moles ofl, nor the time required to deplete the moles of reactants. Procedure Overview: Measured volumes of several solutions having known concen- trations of reactants are mixed in a series of trials. The time required for a visible color change to appear in the solution is recorded for the series of trials. The data are collected and plotted (two plots). From the plotted data, the order of the reaction with respect to each reactant is calculated and the rate law for the reaction is derived. After the rate law for the reaction is established the reaction rate is observed at nonambient temperatures. The plotted data produces a value for the activation energy of the reaction. Read the entire procedure before beginning the experiment. Student pairs should gather the kinetic data, 1. Prepare solution A for the kinetic trials. Table 5.1 summarizes the preparation of the solutions for the kinetic trials. Use deionized water. Use clean pipets to measure all the solutions except for the starch. At the same time, prepare all of the solutions A for kinetic trials 1-7 in clean and labeled large test tubes 2. Prepare solutions for kinetic trial 4. Solution A. Stir the solution in a large test tube. Solution B. Pipet 3.0 mL of 0.1 MH.O, into a large test tube. 3. Prepare for the reaction. The reaction begins when the H2O: (solution B) is added to solution A: be prepared to start timing the reaction in seconds. Place the beaker on a white sheet of paper so the deep-blue color change is more easily detected (Figure 5.2). As one student mixes the solutions, the other notes the time All of the solutions should be at ambient temperature before mixing. Record the temperature. 4. Time the reaction. Rapidly add solution B to solution A. START TIME and swirl (once the contents of the mixture. Continued swirling is unnecessary. The appear- ance of the deep blue color is sudden. Be ready to STOP TIME. Record the time lapse to the nearest second on the Report Sheet Repeat if necessary, Notice! If the time for the color change of trial 4 is less than 10 seconds, STOP. Add an additional 10 ml of boiled, deionized water to each solution A for each kinetic trial (total volume of the reaction mixtures will now be 20 ml instead of 10 ml). A consequence of this dilution will result in a much longer time lapse for a color change in Trial 1-be patient Consult with your laboro tory instructor before the addition of the 10 mL of boiled, deionized water Solution 10mL breaker 160 Solution A 20 mL beker 20-ml beaker white paper Cleanliness is important in preparing these solutions because H, O, readily decomposes in the pres ence of foreign particles. Do not dry glossware with paper towels. Figure 5.2 Viewing the appearance of the lystarch 2 H,O, 2 H,0 +0, complex 45 ml graduated (-0.1 ml) pipets are suggested for measuring these volumes 80 A Rate Law and Activation Energy Table 5.1 Composition of Test Solutions Solution Solution B Kinetic Trial Deionized Water Buffer 03_MK 0.1_.MH.O.*** 3.00ml 100 ml 100 ml 1:30 ml 200 30 ml. 2.0 mil 10 ml 2.0 ml 0.0 ml 50 ml 002_2 N S 0. 100 ml 1.00 100 ml 1.00ml 100 ml 100 ml 100 ml 100 ml. Starch 5 drops 5 drops sdrops 5 drops 5 drops 5 drops S drops 5 drops 100ml 100 ml 1.00 ML 1:00 ml. 100 ml 3.00ml 3.00 m. 500 ml 7.00 ml. 200 ml *OI MKS, **OSCH COOH and 3 MNCH.CO. **Recce action 5. Repeat for the remaining kinetic trials. Mix and time the test solutions for the remaining seven kinetic trials. If the instructor approves conduct additional kinetic trials, either by repeating those in Table 5.1 or by preparing other combinations of Kl and H.O. Make sure that the total diluted volume remains constant at 10 mL. Disposal: Dispose of the solutions from the kinetic trials in the Waste lodide Salts container CLEANUP: Rinse the beakers or test tubes twice with tap water and discard in the Waste lodide Salts container. Dispose of two final rinses with deionized water in the sink Perform the calculations, carefully me step at a time. Appropriate and correctly pro B. Calculations for grammed software would be invaluable for completing this analysis . As you read Determining the Rate Law through this section, complete the appropriate calculation and record it for each test solution on the Report Sheet 1. Moles of I, produced. Calculate the moles of 5.0, consumed in each kinetic trial. From equation 5.11. the moles of I, that form in the reaction equals one-half the moles of S_0, that react. This also equals the change in the moles of I starting with none at time zero up until a final amount that was produced at the time of the color change. This is designated as-moll, produced. 2. Reaction rate. The reaction rate for each kinetic trial is calculated as the ratio of the moles of l, produced, Amol 1,), to the time lapse. Ir. for the appearance moll, of the deep-blue color Compute these reaction rates and the logarithms of the reaction rates (see equations 5.7 and 5.8) for each kinetic trial and enter them on the Report Sheet. Because the total volume is a constant for all kinetic trials, we do not need to calculate the molar concentrations of the ls produced 3. Initial iodide concentrations. Calculate the initial molar concentration, T.. and the logarithm of the initial molar concentration, log of iodide ion for each kinetic trial." See Prelaboratory Assignment, question 40. 4. Initial hydrogen peroxide concentrations Calculate the initial molar concentra tion, (H.O., and the logarithm of the initial molar concentration, log [H.0, of hydrogen peroxide for each kinetic trial." See Prelaboratory Assignment, question 4e. The moles of I, present initially, at fime zero, is zero "Remember, this is not 0.3 MT because the total volume of the solution is 10 ml after mixing Remember, too, this is not 0.1 MH,O, because the total volume of the solution is 10 ml after mixing C. Determination of the 1. Determination of p from plot of data. Plot on the top half of a sheet of linear Reaction Order, p and q. graph paper (available at the end of this lab manual) or preferably by using appro- for Each Reactant priate software log (Amol 1, Ar), which is log (rate) -axis). versus log II 1.6 Appendix C axis) at constant hydrogen peroxide concentration. Kinetic trials 1. 2. 3. and 4 have the same H.0, concentration. Draw the best straight line through the four points. Calculate the slope of the straight line. The slope is the order of the reac- tion, p. with respect to the iodide ion Appendix C 2. Determination of q from plot of data. Plot on the bottom half of the same sheet of linear graph paper or preferably by using appropriate software log (Amol 1,"Ar) (y-axis) versus log H.O. -axis) at constant iodide ion concentration using kinetic trials 1. 5. 6. and 7. Draw the best straight line through the four points and calculate its slope. The slope of the plot is the order of the reaction, with respect to the hydrogen peroxide 3. Approval of graphs. Have your instructor approve both graphs. D. Determination of k', the 1. Substitution of p and q into rate law. Use the values of p and q (from Part C) Specific Rate Constant for and the rate law.rate Almol 1.) -*ITTH.O.' to determine k' for the seven the Reaction ar solutions. Calculate the average value of N' with proper units. Also determine the Appendix B standard deviation and relative standard deviation (RSD) of K' from your data 2. Class data. Obtain average k' values from other groups in the class. Calculate a standard deviation and relative standard deviation (RSD) of k' for the class. E. Determination of 1. Prepare test solutions. Refer to Table 5.1. kinetic trial 4. In separate, clean 150 mm Activation Energy test tubes prepare two additional sets of solution A and solution B. Place onc (solution A/solution B) set in an ice bath. Place the other set in a warm water (-35C) bath, Allow thermal equilibrium to be established for each set, about 5 minutes Test solutions prepared at other temperatures are encouraged for additional data points. 2. Mix solutions A and B. When thermal equilibrium has been established, quickly pour solution B into solution A. START TIME, and agitate the mixture. Place it back in the bath. When the deep blue color appears. STOP TIME. Record the time lapse as before. Record the temperature of the water bath and use this time lapse for your calculations. Repeat to check reproducibility and for the other set(s) of solutions 3. The reaction rates and "new" rate constants. The procedure for determining the reaction rates is described in Part B.2. Calculate and record the reaction rates for the (at least two trials (two temperatures) from Part E.2 and re-record the reaction rate for the room temperature) kinetic trial 4 in Part A. Carefully complete the calculations on the Report Sheet Use the reaction rates at the three temperatures (ice, room, and 35C tem- peratures) and the established rate law from Part to calculate the rate constants, Appendix c k' at these temperatures. Calculate the natural logarithm of these rate constants 4. Plot the data. Plot In k' versus 1/TU) for the (at least) three trials at which the experiment was performed. Remember to express temperature in kelvins and R = 8.314 J/molek 5. Activation energy. From the data plot, detenine the slope of the linear plot (-ER) and calculate the activation energy for the reaction. You may need to seck the advice of your instructor for completing the calculations on the Report Sheet. The Next Step The rate law for any number of chemical reactions can be studied in the same manner - for example, see Experiment 4. Parts B.C. and F. Research the Internet for a kinetic study of interes (biochemical and design a systematic kinetic study of a chemical system. 82 A Rate Law and Activation Energy 1
Step by Step Solution
There are 3 Steps involved in it

Get step-by-step solutions from verified subject matter experts