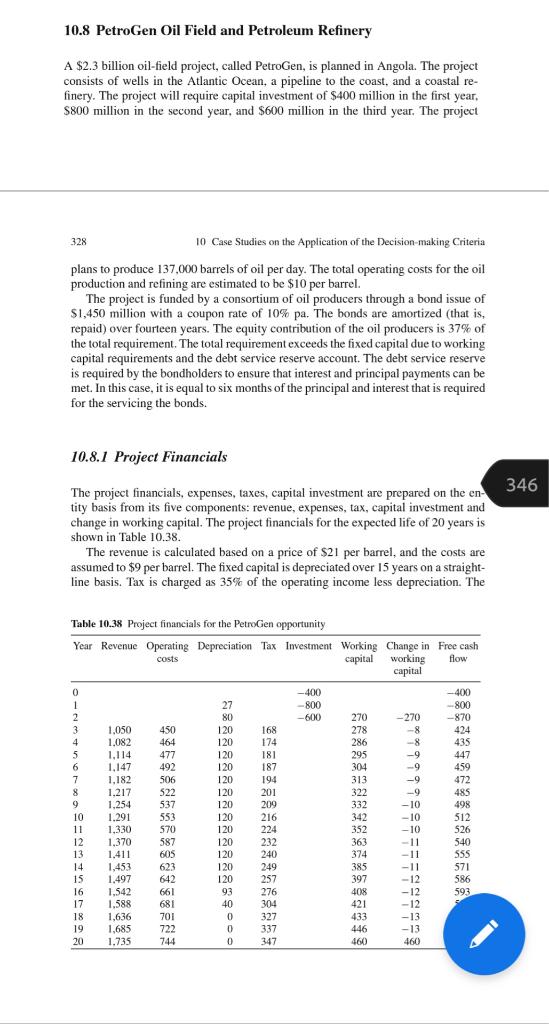
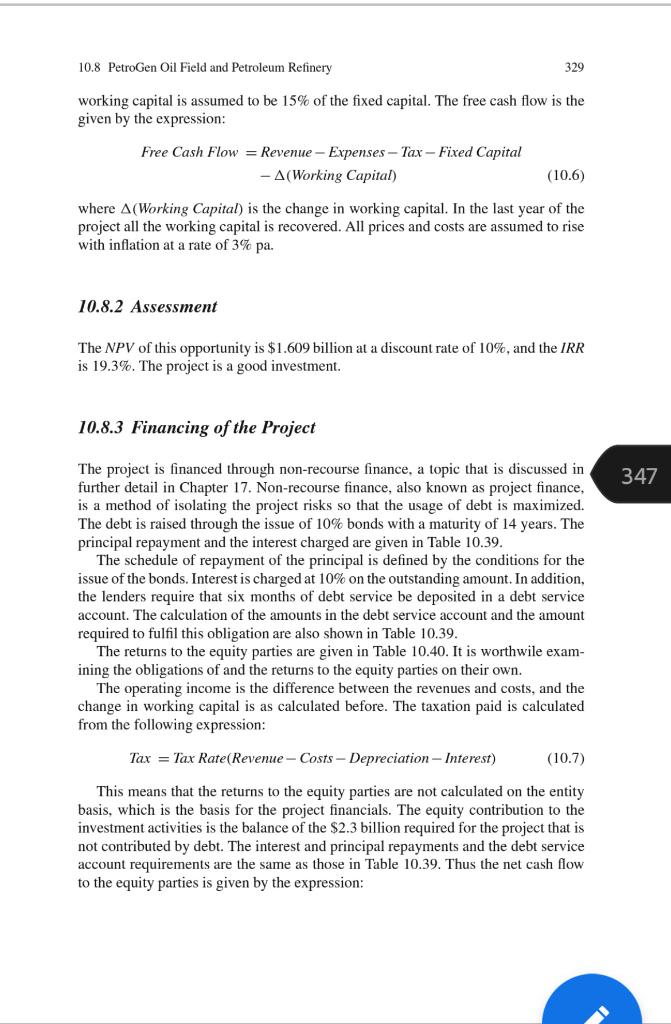
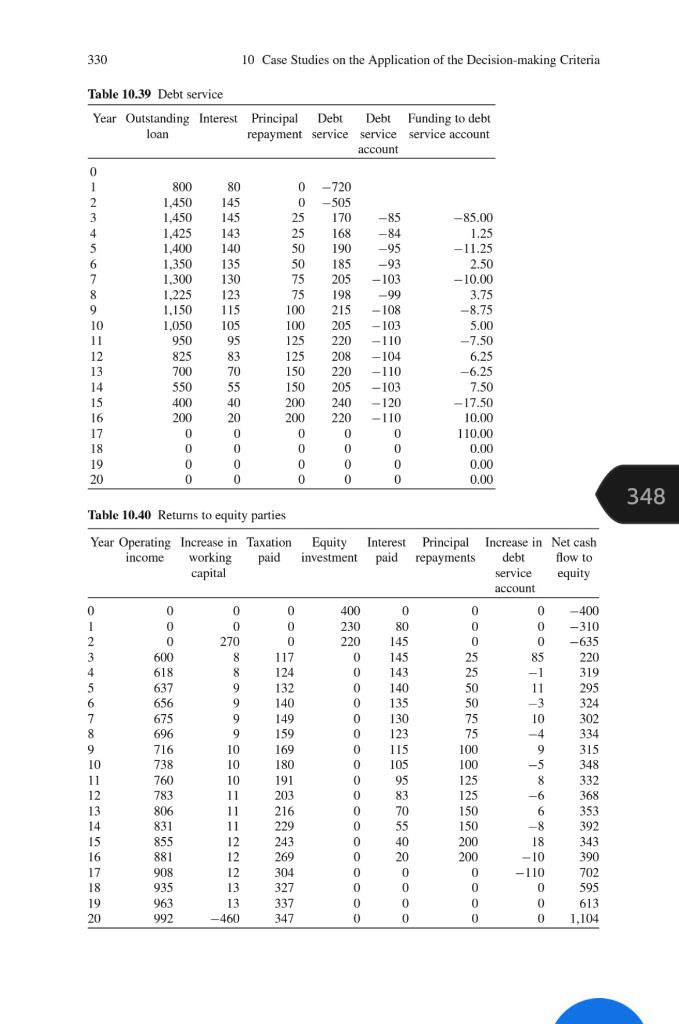
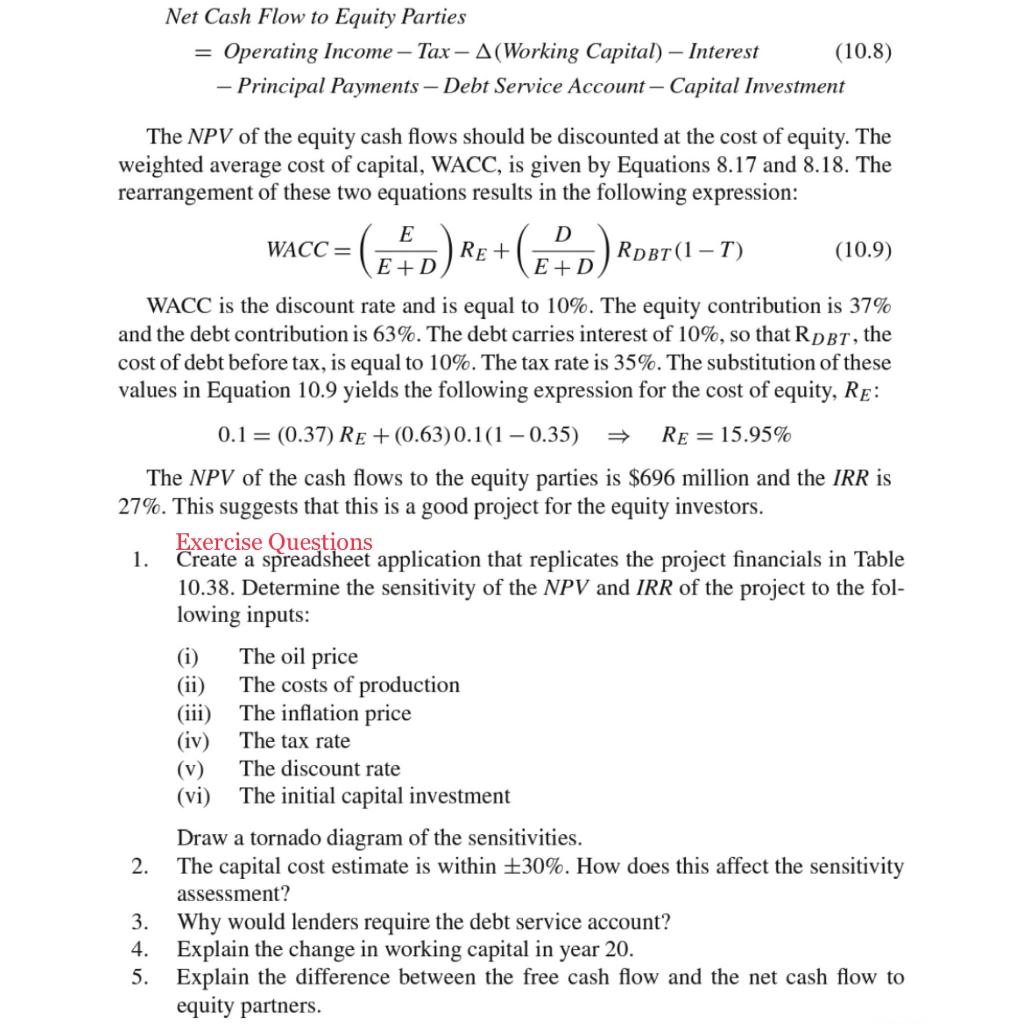
10.8 PetroGen Oil Field and Petroleum Refinery A $2.3 billion oil-field project, called PetroGen, is planned in Angola. The project consists of wells in the Atlantic Ocean, a pipeline to the coast, and a coastal re- finery. The project will require capital investment of $400 million in the first year, $800 million in the second year, and $600 million in the third year. The project 328 10 Case Studies on the Application of the Decision-making Criteria plans to produce 137,000 barrels of oil per day. The total operating costs for the oil production and refining are estimated to be $10 per barrel. The project is funded by a consortium of oil producers through a bond issue of $1,450 million with a coupon rate of 10% pa. The bonds are amortized (that is, repaid) over fourteen years. The equity contribution of the oil producers is 37% of the total requirement. The total requirement exceeds the fixed capital due to working capital requirements and the debt service reserve account. The debt service reserve is required by the bondholders to ensure that interest and principal payments can be met. In this case, it is equal to six months of the principal and interest that is required for the servicing the bonds. 10.8.1 Project Financials 346 The project financials, expenses, taxes, capital investment are prepared on the en tity basis from its five components: revenue, expenses, tax, capital investment and change in working capital. The project financials for the expected life of 20 years is shown in Table 10.38. The revenue is calculated based on a price of $21 per barrel, and the costs are assumed to $9 per barrel. The fixed capital is depreciated over 15 years on a straight- line basis. Tax is charged as 35% of the operating income less depreciation. The Table 10.38 Project financials for the PetroGen opportunity Year Revenue Operating Depreciation Tax Investment Working Change in Free cash costs capital working flow capital 0 -400 -400 1 27 -800 -800 2 80 -600 270 -270 -870 3 1.050 450 120 168 278 -8 424 4 1,082 464 120 174 286 -8 435 5 477 120 181 295 -9 447 6 1.147 492 120 187 304 -9 459 7 1.182 506 120 194 313 -9 472 8 1.217 522 120 201 322 9 485 9 1.254 537 120 209 332 -10 498 10 1.291 553 120 216 342 -10 512 11 1,330 570 120 224 352 -10 526 12 1,370 587 120 232 363 -11 540 13 1.411 605 120 240 374 -11 14 1,453 623 120 249 385 -11 571 15 1.497 642 120 257 397 - 12 586 16 1.542 93 276 408 -12 593 17 1.588 681 40 304 421 -12 18 1,636 701 0 327 433 -13 19 1,685 722 0 337 446 -13 20 1.735 744 0 347 460 460 **9999999999999999 661 10.8 PetroGen Oil Field and Petroleum Refinery 329 working capital is assumed to be 15% of the fixed capital. The free cash flow is the given by the expression: Free Cash Flow = Revenue - Expenses - Tax- Fixed Capital - A(Working Capital) (10.6) where A(Working Capital) is the change in working capital. In the last year of the project all the working capital is recovered. All prices and costs are assumed to rise with inflation at a rate of 3% pa. 10.8.2 Assessment The NPV of this opportunity is $1.609 billion at a discount rate of 10%, and the IRR is 19.3%. The project is a good investment. 10.8.3 Financing of the Project 347 The project is financed through non-recourse finance, a topic that is discussed in further detail in Chapter 17. Non-recourse finance, also known as project finance, is a method of isolating the project risks so that the usage of debt is maximized. The debt is raised through the issue of 10% bonds with a maturity of 14 years. The principal repayment and the interest charged are given in Table 10.39. The schedule of repayment of the principal is defined by the conditions for the issue of the bonds. Interest is charged at 10% on the outstanding amount. In addition, the lenders require that six months of debt service be deposited in a debt service account. The calculation of the amounts in the debt service account and the amount required to fulfil this obligation are also shown in Table 10.39. The returns to the equity parties are given in Table 10.40. It is worthwile exam- ining the obligations of and the returns to the equity parties on their own. The operating income is the difference between the revenues and costs, and the change in working capital is as calculated before. The taxation paid is calculated from the following expression: Tax = Tax Rate(Revenue - Costs - Depreciation - Interest) (10.7) This means that the returns to the equity parties are not calculated on the entity basis, which is the basis for the project financials. The equity contribution to the investment activities is the balance of the $2.3 billion required for the project that is not contributed by debt. The interest and principal repayments and the debt service account requirements are the same as those in Table 10.39. Thus the net cash flow to the equity parties is given by the expression: 330 10 Case Studies on the Application of the Decision-making Criteria Table 10.39 Debt service Year Outstanding Interest Principal Debt Debt Funding to debt loan repayment service service service account account 80 145 145 143 140 135 130 123 115 0 1 2 3 2 4 4 5 3 6 7 8 9 10 11 12 13 14 15 16 17 18 19 20 800 1,450 1,450 1,425 1,400 1,350 1,300 1,225 1.150 1,050 950 825 700 550 400 200 0 0 0 0 105 95 83 70 55 40 20 0 0 0 0 0-720 0 -505 25 170 25 168 50 190 50 185 75 205 75 198 100 215 100 205 125 220 125 208 150 220 150 205 200 240 220 0 0 0 0 0 0 0 0 -85 -84 -95 --93 - 103 -99 - 108 - 103 -110 -104 -110 -103 -120 -110 0 0 0 0 - 85.00 1.25 - 11.25 2.50 - 10.00 3.75 -8.75 5.00 -7.50 6.25 -6.25 7.50 -17.50 10.00 110.00 200 0.00 0.00 0.00 348 Table 10.40 Returns to equity parties Year Operating Increase in Taxation Equity Interest Principal Increase in Net cash income working paid investment paid repayments debt flow to capital service equity account 0 0 400 230 220 0 0 0 600 618 637 656 0 270 8 8 0 0 0 0 85 -1 11 0 0 9 9 9 675 0 0 0 0 10 -4 1 2 3 4 5 6 7 8 9 9 10 11 12 13 12 14 15 16 17 18 19 20 696 716 738 760 783 806 831 855 881 908 935 963 992 0 0 0 117 124 132 140 149 159 169 180 191 203 216 229 243 269 304 327 337 347 9 10 10 10 11 11 11 12 12 12 13 13 -460 -400 -310 -635 220 319 295 324 302 334 315 348 332 368 500 353 392 343 0 80 145 145 143 140 135 130 123 115 105 95 83 70 55 40 20 0 0 0 0 0 0 0 U 0 0 0 0 0 0 0 0 0 0 0 0 25 25 50 50 75 75 100 100 125 125 150 150 200 200 0 0 0 9 -5 8 8 -6 6 -8 18 -10 -110 0 0 0 390 702 595 613 1,104 Net Cash Flow to Equity Parties = Operating Income Tax A(Working Capital) Interest (10.8) - Principal Payments Debt Service Account - Capital Investment The NPV of the equity cash flows should be discounted at the cost of equity. The weighted average cost of capital, WACC, is given by Equations 8.17 and 8.18. The rearrangement of these two equations results in the following expression: E D WACC = RE + RDBT(1-T) (10.9) E+D E+D WACC is the discount rate and is equal to 10%. The equity contribution is 37% and the debt contribution is 63%. The debt carries interest of 10%, so that RDBT, the cost of debt before tax, is equal to 10%. The tax rate is 35%. The substitution of these values in Equation 10.9 yields the following expression for the cost of equity, Re: 0.1 = (0.37) RE +(0.63)0.1(1 0.35) RE= 15.95% The NPV of the cash flows to the equity parties is $696 million and the IRR is 27%. This suggests that this is a good project for the equity investors. Exercise Questions 1. Create a spreadsheet application that replicates the project financials in Table 10.38. Determine the sensitivity of the NPV and IRR of the project to the fol- lowing inputs: The oil price (ii) The costs of production (iii) The inflation price (iv) The tax rate (v) The discount rate (vi) The initial capital investment Draw a tornado diagram of the sensitivities. The capital cost estimate is within 30%. How does this affect the sensitivity assessment? 3. Why would lenders require the debt service account? 4. Explain the change in working capital in year 20. 5. Explain the difference between the free cash flow and the net cash flow to equity partners. 2. 10.8 PetroGen Oil Field and Petroleum Refinery A $2.3 billion oil-field project, called PetroGen, is planned in Angola. The project consists of wells in the Atlantic Ocean, a pipeline to the coast, and a coastal re- finery. The project will require capital investment of $400 million in the first year, $800 million in the second year, and $600 million in the third year. The project 328 10 Case Studies on the Application of the Decision-making Criteria plans to produce 137,000 barrels of oil per day. The total operating costs for the oil production and refining are estimated to be $10 per barrel. The project is funded by a consortium of oil producers through a bond issue of $1,450 million with a coupon rate of 10% pa. The bonds are amortized (that is, repaid) over fourteen years. The equity contribution of the oil producers is 37% of the total requirement. The total requirement exceeds the fixed capital due to working capital requirements and the debt service reserve account. The debt service reserve is required by the bondholders to ensure that interest and principal payments can be met. In this case, it is equal to six months of the principal and interest that is required for the servicing the bonds. 10.8.1 Project Financials 346 The project financials, expenses, taxes, capital investment are prepared on the en tity basis from its five components: revenue, expenses, tax, capital investment and change in working capital. The project financials for the expected life of 20 years is shown in Table 10.38. The revenue is calculated based on a price of $21 per barrel, and the costs are assumed to $9 per barrel. The fixed capital is depreciated over 15 years on a straight- line basis. Tax is charged as 35% of the operating income less depreciation. The Table 10.38 Project financials for the PetroGen opportunity Year Revenue Operating Depreciation Tax Investment Working Change in Free cash costs capital working flow capital 0 -400 -400 1 27 -800 -800 2 80 -600 270 -270 -870 3 1.050 450 120 168 278 -8 424 4 1,082 464 120 174 286 -8 435 5 477 120 181 295 -9 447 6 1.147 492 120 187 304 -9 459 7 1.182 506 120 194 313 -9 472 8 1.217 522 120 201 322 9 485 9 1.254 537 120 209 332 -10 498 10 1.291 553 120 216 342 -10 512 11 1,330 570 120 224 352 -10 526 12 1,370 587 120 232 363 -11 540 13 1.411 605 120 240 374 -11 14 1,453 623 120 249 385 -11 571 15 1.497 642 120 257 397 - 12 586 16 1.542 93 276 408 -12 593 17 1.588 681 40 304 421 -12 18 1,636 701 0 327 433 -13 19 1,685 722 0 337 446 -13 20 1.735 744 0 347 460 460 **9999999999999999 661 10.8 PetroGen Oil Field and Petroleum Refinery 329 working capital is assumed to be 15% of the fixed capital. The free cash flow is the given by the expression: Free Cash Flow = Revenue - Expenses - Tax- Fixed Capital - A(Working Capital) (10.6) where A(Working Capital) is the change in working capital. In the last year of the project all the working capital is recovered. All prices and costs are assumed to rise with inflation at a rate of 3% pa. 10.8.2 Assessment The NPV of this opportunity is $1.609 billion at a discount rate of 10%, and the IRR is 19.3%. The project is a good investment. 10.8.3 Financing of the Project 347 The project is financed through non-recourse finance, a topic that is discussed in further detail in Chapter 17. Non-recourse finance, also known as project finance, is a method of isolating the project risks so that the usage of debt is maximized. The debt is raised through the issue of 10% bonds with a maturity of 14 years. The principal repayment and the interest charged are given in Table 10.39. The schedule of repayment of the principal is defined by the conditions for the issue of the bonds. Interest is charged at 10% on the outstanding amount. In addition, the lenders require that six months of debt service be deposited in a debt service account. The calculation of the amounts in the debt service account and the amount required to fulfil this obligation are also shown in Table 10.39. The returns to the equity parties are given in Table 10.40. It is worthwile exam- ining the obligations of and the returns to the equity parties on their own. The operating income is the difference between the revenues and costs, and the change in working capital is as calculated before. The taxation paid is calculated from the following expression: Tax = Tax Rate(Revenue - Costs - Depreciation - Interest) (10.7) This means that the returns to the equity parties are not calculated on the entity basis, which is the basis for the project financials. The equity contribution to the investment activities is the balance of the $2.3 billion required for the project that is not contributed by debt. The interest and principal repayments and the debt service account requirements are the same as those in Table 10.39. Thus the net cash flow to the equity parties is given by the expression: 330 10 Case Studies on the Application of the Decision-making Criteria Table 10.39 Debt service Year Outstanding Interest Principal Debt Debt Funding to debt loan repayment service service service account account 80 145 145 143 140 135 130 123 115 0 1 2 3 2 4 4 5 3 6 7 8 9 10 11 12 13 14 15 16 17 18 19 20 800 1,450 1,450 1,425 1,400 1,350 1,300 1,225 1.150 1,050 950 825 700 550 400 200 0 0 0 0 105 95 83 70 55 40 20 0 0 0 0 0-720 0 -505 25 170 25 168 50 190 50 185 75 205 75 198 100 215 100 205 125 220 125 208 150 220 150 205 200 240 220 0 0 0 0 0 0 0 0 -85 -84 -95 --93 - 103 -99 - 108 - 103 -110 -104 -110 -103 -120 -110 0 0 0 0 - 85.00 1.25 - 11.25 2.50 - 10.00 3.75 -8.75 5.00 -7.50 6.25 -6.25 7.50 -17.50 10.00 110.00 200 0.00 0.00 0.00 348 Table 10.40 Returns to equity parties Year Operating Increase in Taxation Equity Interest Principal Increase in Net cash income working paid investment paid repayments debt flow to capital service equity account 0 0 400 230 220 0 0 0 600 618 637 656 0 270 8 8 0 0 0 0 85 -1 11 0 0 9 9 9 675 0 0 0 0 10 -4 1 2 3 4 5 6 7 8 9 9 10 11 12 13 12 14 15 16 17 18 19 20 696 716 738 760 783 806 831 855 881 908 935 963 992 0 0 0 117 124 132 140 149 159 169 180 191 203 216 229 243 269 304 327 337 347 9 10 10 10 11 11 11 12 12 12 13 13 -460 -400 -310 -635 220 319 295 324 302 334 315 348 332 368 500 353 392 343 0 80 145 145 143 140 135 130 123 115 105 95 83 70 55 40 20 0 0 0 0 0 0 0 U 0 0 0 0 0 0 0 0 0 0 0 0 25 25 50 50 75 75 100 100 125 125 150 150 200 200 0 0 0 9 -5 8 8 -6 6 -8 18 -10 -110 0 0 0 390 702 595 613 1,104 Net Cash Flow to Equity Parties = Operating Income Tax A(Working Capital) Interest (10.8) - Principal Payments Debt Service Account - Capital Investment The NPV of the equity cash flows should be discounted at the cost of equity. The weighted average cost of capital, WACC, is given by Equations 8.17 and 8.18. The rearrangement of these two equations results in the following expression: E D WACC = RE + RDBT(1-T) (10.9) E+D E+D WACC is the discount rate and is equal to 10%. The equity contribution is 37% and the debt contribution is 63%. The debt carries interest of 10%, so that RDBT, the cost of debt before tax, is equal to 10%. The tax rate is 35%. The substitution of these values in Equation 10.9 yields the following expression for the cost of equity, Re: 0.1 = (0.37) RE +(0.63)0.1(1 0.35) RE= 15.95% The NPV of the cash flows to the equity parties is $696 million and the IRR is 27%. This suggests that this is a good project for the equity investors. Exercise Questions 1. Create a spreadsheet application that replicates the project financials in Table 10.38. Determine the sensitivity of the NPV and IRR of the project to the fol- lowing inputs: The oil price (ii) The costs of production (iii) The inflation price (iv) The tax rate (v) The discount rate (vi) The initial capital investment Draw a tornado diagram of the sensitivities. The capital cost estimate is within 30%. How does this affect the sensitivity assessment? 3. Why would lenders require the debt service account? 4. Explain the change in working capital in year 20. 5. Explain the difference between the free cash flow and the net cash flow to equity partners. 2