Solution of question (Chapter 7, Problem 2WM) from book (Loose Leaf Essentials of Investments with Connect Plus (9th Edition))
Note: question 1WM already solved in Chegg
Attached is the solution for 1WM
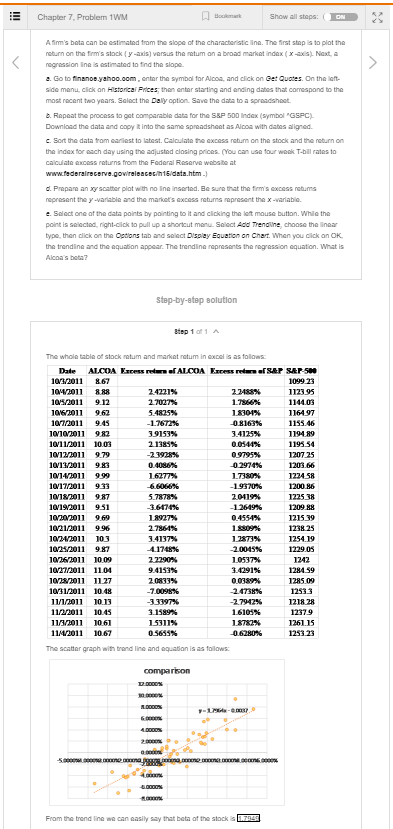
Chapter 7. Problem 1WM Bom Show all steps: ON Afirm's bata can be estimated from the slope of the characteristicine. The first step is to plot the return on the firm's stock yaxs) vous the rotum on a broad market index (x-axis). Next, a regression Ine is estimated to Ind the slope a. Go to finance.yahoo.com, enter the symbol for Alcon and click on Get Quotes. On the left Side menu, click on Historical Prices then enter starting and ending dates that correspond to the most recent two years. Select the Daly option Save the data to a spreadsheet Repeat the process to get comparable data for the S&P 500 Index (symbol "GSPC) Download the data and copy into the same spreadsheet as Alcon with dates aligned Sort the data from earliest to latest Calculate the excess return on the stock and the return on the index for each day using the adjusted closing prices You can use four wo T-bil rates to calculate excess returns from the Federal Reserve website at www.federalrecarve.goviraleacec/h15/data.htm d. Prepare an xy scatter plot with no in inserted. Be sure that the firm's excess retums represent the y-variable and the market's costums mapresent the x-variable e. Select one of the data points by pointing to it and clicking the lot mouse button. While the point is selected, right-click to pull up a shortcut monu. Select Add Trendline choose the linear type, then click on the options tab and select Display Equation on Chart. When you click on OK the trendline and the equation appear. The trending represents the regression equation. What is Alcoa's bota Step-by-step solution Step 1 of 1 A The whole table of stock rotum and market ratum in excel is as follows Date ALCOA Experten ALCOA Eesretnu 101 011 867 104/2011 RRR 10/5/2011 9.12 270278 10/6/2011 9.62 1.8301% 1010119.45 08163% 10/10/2011 982 39153% 3.4125% 10/11/2011 10.03 0.0544% 10/12/2011 9.79 -23928% 09795% 10713011 983 0409 0.2974% 10/14/2011 999 16277% 1.7380 1017011933 -19920% 10/18/2011 987 5.7878% 20119% 10/19/2011 951 36610% 1269% 10/20/2011 969 18927% 04554% 10/21/2011 9.96 2.78.64% 10/24/2011 103 3.4137% 1.7873X 10/25/2011 987 4.17 % 20015% 10/26/2011 10 09 2 2290% 1 0537 100011 1104 9.41538 10/12/2011 11.27 20833% 00389% 10/31/2011 10.48 -7.0095% 11/1/2011 10.13 -7 1997 -2.7942% 110011 10.45 31989% 1.6105% 113/2011 1061 15911% 1.8783% 1111011 10.67 0 5655 0.6280% The scatter graph with trand line and equation is as follows: SAP-50 1099 23 1123.95 1144.03 1164.97 1155.46 1194 89 1195.54 1207.25 1203.06 1224 58 1200.86 1225 38 1209 89 1215 39 123825 1254 19 1229.05 1242 1294.59 1285 09 23 1218 28 12379 1261 15 1253.23 comparison S unna From the trendline we can easily say that both of the stock 17943 Chapter 7. Problem 1WM Bom Show all steps: ON Afirm's bata can be estimated from the slope of the characteristicine. The first step is to plot the return on the firm's stock yaxs) vous the rotum on a broad market index (x-axis). Next, a regression Ine is estimated to Ind the slope a. Go to finance.yahoo.com, enter the symbol for Alcon and click on Get Quotes. On the left Side menu, click on Historical Prices then enter starting and ending dates that correspond to the most recent two years. Select the Daly option Save the data to a spreadsheet Repeat the process to get comparable data for the S&P 500 Index (symbol "GSPC) Download the data and copy into the same spreadsheet as Alcon with dates aligned Sort the data from earliest to latest Calculate the excess return on the stock and the return on the index for each day using the adjusted closing prices You can use four wo T-bil rates to calculate excess returns from the Federal Reserve website at www.federalrecarve.goviraleacec/h15/data.htm d. Prepare an xy scatter plot with no in inserted. Be sure that the firm's excess retums represent the y-variable and the market's costums mapresent the x-variable e. Select one of the data points by pointing to it and clicking the lot mouse button. While the point is selected, right-click to pull up a shortcut monu. Select Add Trendline choose the linear type, then click on the options tab and select Display Equation on Chart. When you click on OK the trendline and the equation appear. The trending represents the regression equation. What is Alcoa's bota Step-by-step solution Step 1 of 1 A The whole table of stock rotum and market ratum in excel is as follows Date ALCOA Experten ALCOA Eesretnu 101 011 867 104/2011 RRR 10/5/2011 9.12 270278 10/6/2011 9.62 1.8301% 1010119.45 08163% 10/10/2011 982 39153% 3.4125% 10/11/2011 10.03 0.0544% 10/12/2011 9.79 -23928% 09795% 10713011 983 0409 0.2974% 10/14/2011 999 16277% 1.7380 1017011933 -19920% 10/18/2011 987 5.7878% 20119% 10/19/2011 951 36610% 1269% 10/20/2011 969 18927% 04554% 10/21/2011 9.96 2.78.64% 10/24/2011 103 3.4137% 1.7873X 10/25/2011 987 4.17 % 20015% 10/26/2011 10 09 2 2290% 1 0537 100011 1104 9.41538 10/12/2011 11.27 20833% 00389% 10/31/2011 10.48 -7.0095% 11/1/2011 10.13 -7 1997 -2.7942% 110011 10.45 31989% 1.6105% 113/2011 1061 15911% 1.8783% 1111011 10.67 0 5655 0.6280% The scatter graph with trand line and equation is as follows: SAP-50 1099 23 1123.95 1144.03 1164.97 1155.46 1194 89 1195.54 1207.25 1203.06 1224 58 1200.86 1225 38 1209 89 1215 39 123825 1254 19 1229.05 1242 1294.59 1285 09 23 1218 28 12379 1261 15 1253.23 comparison S unna From the trendline we can easily say that both of the stock 17943