solve all
a)answer all question answers either i will dislike thrice
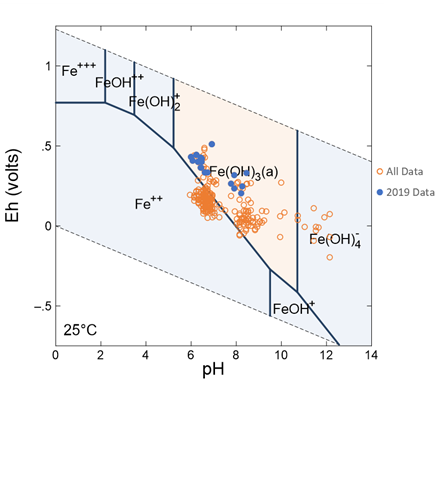
The data below show the changes in EH as a function of time at a coal ash disposal site contaminated with arsenic. The company began excavating the coal ash for disposal elsewhere in a lined basin. Excavation began in February 2019 and the measured values are from three well depths B, C, and D corresponding to 5, 10, and 20 meters below ground. Explain what you believe happened to cause the observed increase in EH. Then propose what you believe happened to the arsenic groundwater concentrations in these wells after the excavation using the concepts discussed in part a. For your reference, a Pourbaix diagram of iron is provided on the next page with the measured pH and EH vales overlain.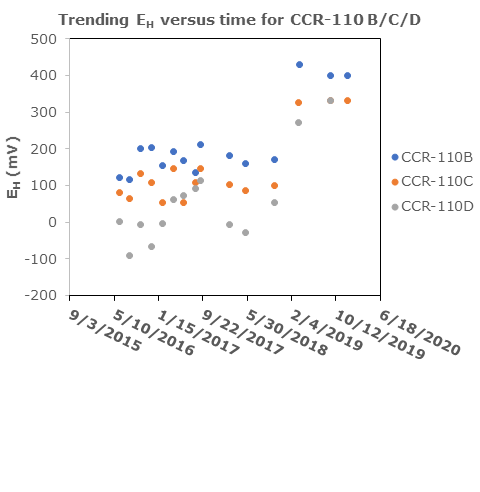
 Data
Data
 Data
Data
 Question
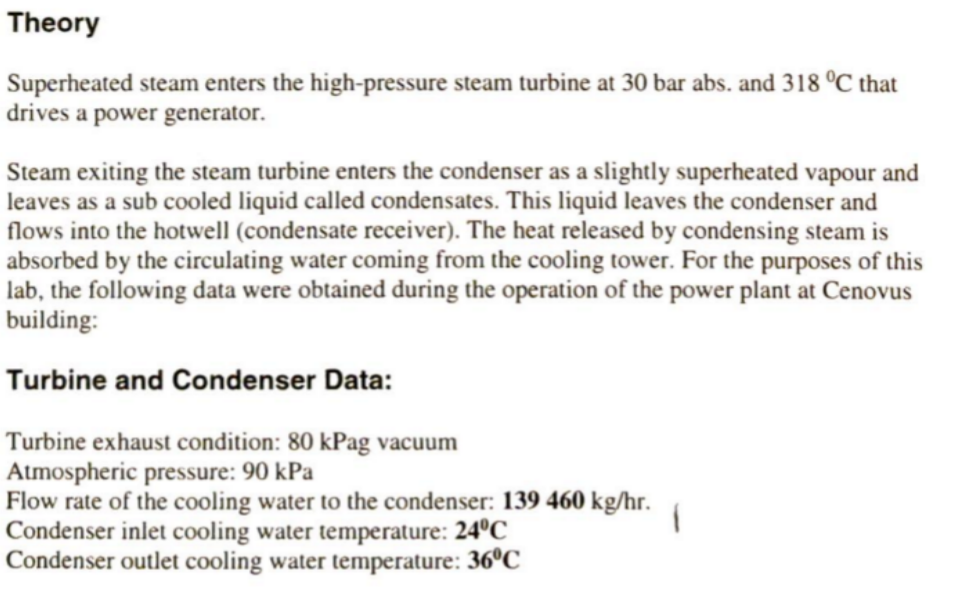
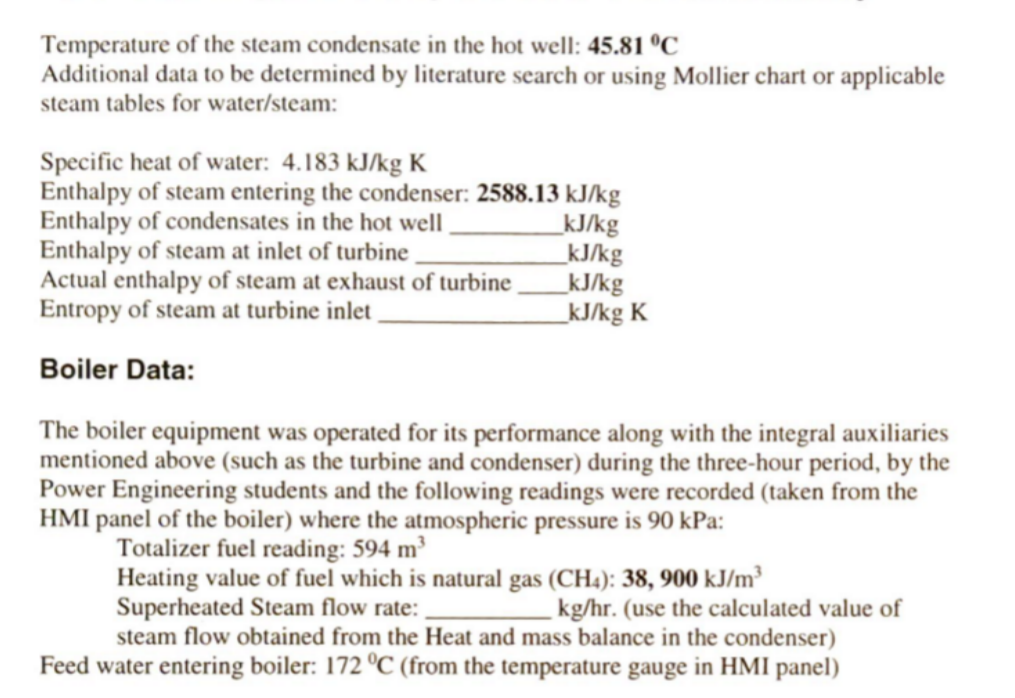
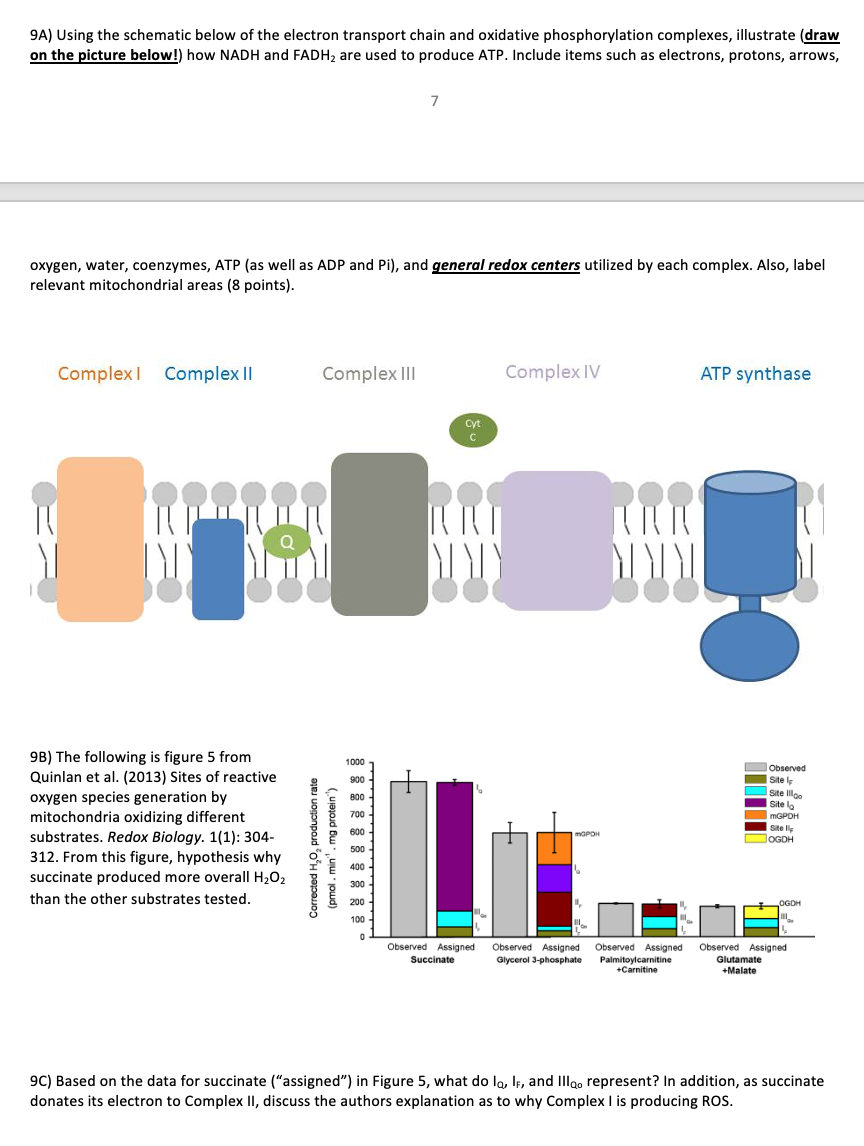
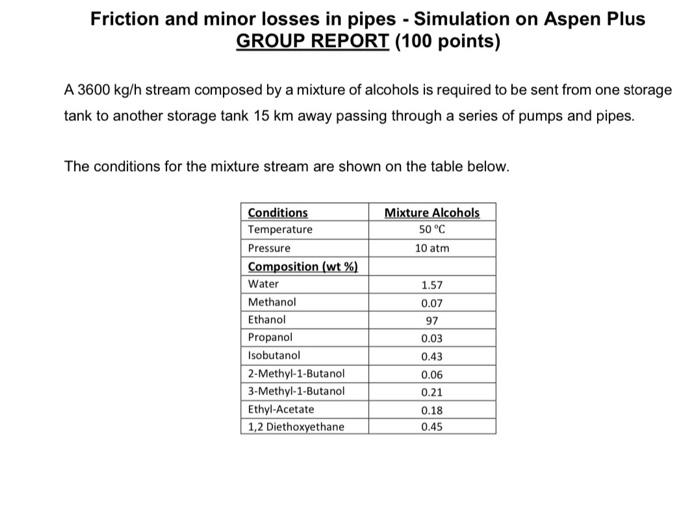
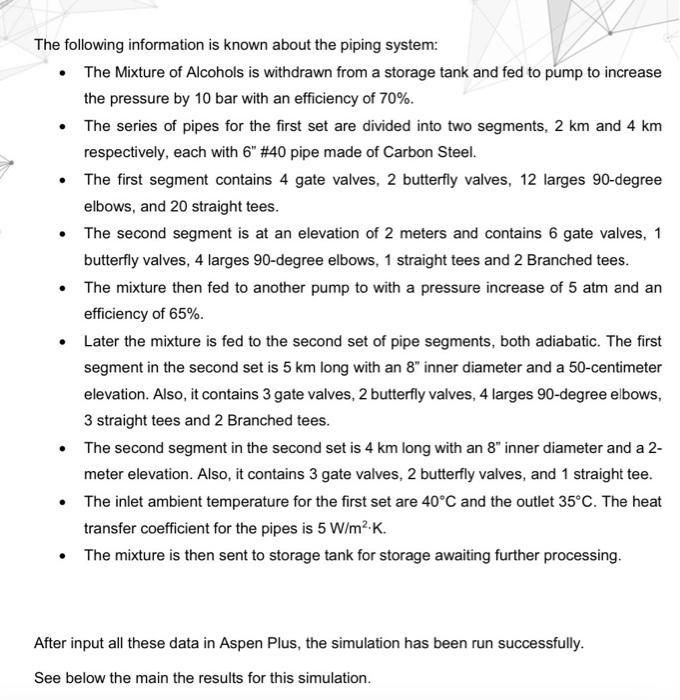
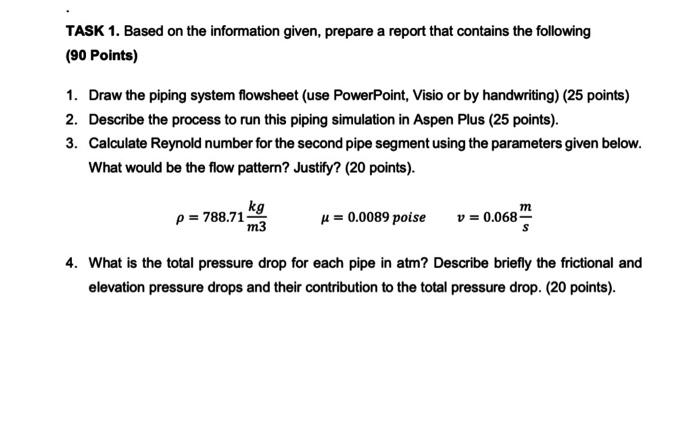
Theory Superheated steam enters the high-pressure steam turbine at 30 bar abs. and 318 C that drives a power generator. Steam exiting the steam turbine enters the condenser as a slightly superheated vapour and leaves as a sub cooled liquid called condensates. This liquid leaves the condenser and flows into the hotwell (condensate receiver). The heat released by condensing steam is absorbed by the circulating water coming from the cooling tower. For the purposes of this lab, the following data were obtained during the operation of the power plant at Cenovus building: Turbine and Condenser Data: Turbine exhaust condition: 80 kPag vacuum Atmospheric pressure: 90 kPa Flow rate of the cooling water to the condenser: 139 460 kg/hr. Condenser inlet cooling water temperature: 24C Condenser outlet cooling water temperature: 36C Temperature of the steam condensate in the hot well: 45.81 C Additional data to be determined by literature search or using Mollier chart or applicable steam tables for water/steam: Specific heat of water: 4.183 kJ/kg K Enthalpy of steam entering the condenser: 2588.13 kJ/kg Enthalpy of condensates in the hot well _kJ/kg Enthalpy of steam at inlet of turbine _kJ/kg Actual enthalpy of steam at exhaust of turbine _kJ/kg Entropy of steam at turbine inlet _kJ/kg K Boiler Data: The boiler equipment was operated for its performance along with the integral auxiliaries mentioned above (such as the turbine and condenser) during the three-hour period, by the Power Engineering students and the following readings were recorded (taken from the HMI panel of the boiler) where the atmospheric pressure is 90 kPa: Totalizer fuel reading: 594 m Heating value of fuel which is natural gas (CH4): 38, 900 kJ/m3 Superheated Steam flow rate: kg/hr. (use the calculated value of steam flow obtained from the Heat and mass balance in the condenser) Feed water entering boiler: 172 C (from the temperature gauge in HMI panel) Trending E. versus time for CCR-110 B/C/D 500 400 300 200 EH (mv) 100 CCR-110B CCR-1100 CCR-110D 0 -100 6/18/2020 10/12/2019 2/4/2019 5/30/2018 9/22/2017 1/15/2017 5/10/2016 9/3/2015 -200 1 +++ Fe Feoht Fe(OH 5 Fe(OH)2(a) Eh (volts) All Data 2019 Data Fett Fe(OH) FeOH 25C 0 2 N 10 12 14 8 . 9A) Using the schematic below of the electron transport chain and oxidative phosphorylation complexes, illustrate (draw on the picture below!) how NADH and FADH2 are used to produce ATP. Include items such as electrons, protons, arrows, 7 oxygen, water, coenzymes, ATP (as well as ADP and Pi), and general redox centers utilized by each complex. Also, label relevant mitochondrial areas (8 points). Complex Complex 11 Complex III Complex IV ATP synthase Cyt C MT MI TITI MUY vo 1000 900 800 9B) The following is figure 5 from Quinlan et al. (2013) Sites of reactive oxygen species generation by mitochondria oxidizing different substrates. Redox Biology. 1(1): 304- 312. From this figure, hypothesis why succinate produced more overall H2O2 than the other substrates tested. Observed Site Site Illa Site lo MGPOH Sitell OGDH 700 600 Corrected H,, production rate (pmol. min. mg protein 500 I 400 OGDH 100 Observed Assigned Succinate Observed Assigned Observed Assigned Glycerol 3-phosphate Palmitoylcarnitine +Carnitine Observed Assigned Glutamate +Malate 9C) Based on the data for succinate ("assigned") in Figure 5, what do lo, IF, and Illgo represent? In addition, as succinate donates its electron to Complex II, discuss the authors explanation as to why Complex I is producing ROS. Friction and minor losses in pipes - Simulation on Aspen Plus GROUP REPORT (100 points) A 3600 kg/h stream composed by a mixture of alcohols is required to be sent from one storage tank to another storage tank 15 km away passing through a series of pumps and pipes. The conditions for the mixture stream are shown on the table below. Mixture Alcohols 50C 10 atm Conditions Temperature Pressure Composition (wt %) Water Methanol Ethanol Propanol Isobutanol 2-Methyl-1-Butanol 3-Methyl-1-Butanol Ethyl-Acetate 1,2 Diethoxyethane 1.57 0.07 97 0.03 0.43 0.06 0.21 0.18 0.45 The following information is known about the piping system: The Mixture of Alcohols is withdrawn from a storage tank and fed to pump to increase the pressure by 10 bar with an efficiency of 70%. The series of pipes for the first set are divided into two segments, 2 km and 4 km respectively, each with 6" #40 pipe made of Carbon Steel. The first segment contains 4 gate valves, 2 butterfly valves, 12 larges 90-degree elbows, and 20 straight tees. The second segment is at an elevation of 2 meters and contains 6 gate valves, 1 butterfly valves, 4 larges 90-degree elbows, 1 straight tees and 2 Branched tees. The mixture then fed to another pump to with a pressure increase of 5 atm and an efficiency of 65%. Later the mixture is fed to the second set of pipe segments, both adiabatic. The first segment in the second set is 5 km long with an 8" inner diameter and a 50-centimeter elevation. Also, it contains 3 gate valves, 2 butterfly valves, 4 larges 90-degree elbows, 3 straight tees and 2 Branched tees. The second segment in the second set is 4 km long with an 8" inner diameter and a 2- meter elevation. Also, it contains 3 gate valves, 2 butterfly valves, and 1 straight tee. The inlet ambient temperature for the first set are 40C and the outlet 35C. The heat transfer coefficient for the pipes is 5 W/m2.K. The mixture is then sent to storage tank for storage awaiting further processing. After input all these data in Aspen Plus, the simulation has be run successfully. See below the main the results for this simulation. TASK 1. Based on the information given, prepare a report that contains the following (90 Points) 1. Draw the piping system flowsheet (use PowerPoint, Visio or by handwriting) (25 points) 2. Describe the process to run this piping simulation in Aspen Plus (25 points). 3. Calculate Reynold number for the second pipe segment using the parameters given below. What would be the flow pattern? Justify? (20 points). P = 788.71 kg u = 0.0089 poise m v = 0.068 m3 4. What is the total pressure drop for each pipe in atm? Describe briefly the frictional and elevation pressure drops and their contribution to the total pressure drop. (20 points)


 Data
Data Data
Data Question


