Answered step by step
Verified Expert Solution
Question
1 Approved Answer
solve and circle answers make it easy to follow and find !!! An online university has a stable average student population of 23,220 over the
solve and circle answers make it easy to follow and find !!! 
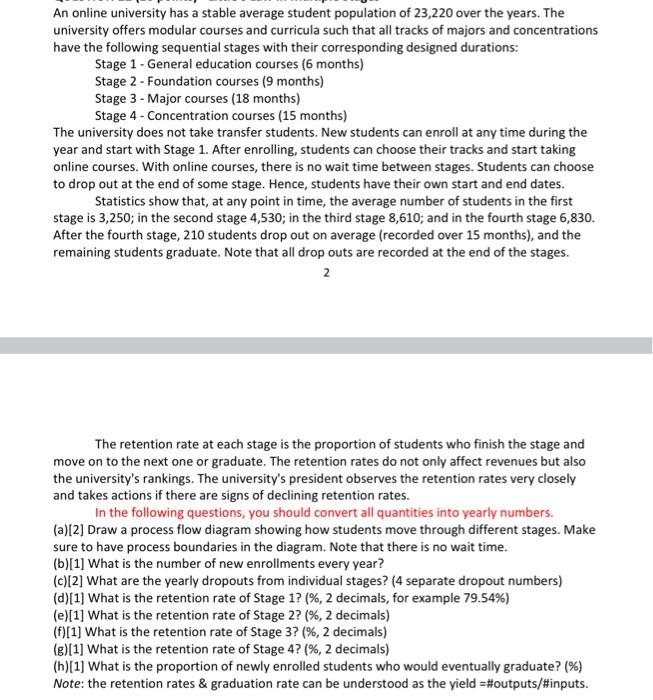
An online university has a stable average student population of 23,220 over the years. The university offers modular courses and curricula such that all tracks of majors and concentrations have the following sequential stages with their corresponding designed durations: Stage 1 - General education courses ( 6 months) Stage 2 - Foundation courses (9 months) Stage 3 - Major courses (18 months) Stage 4 - Concentration courses (15 months) The university does not take transfer students. New students can enroll at any time during the year and start with Stage 1. After enrolling, students can choose their tracks and start taking online courses. With online courses, there is no wait time between stages. Students can choose to drop out at the end of some stage. Hence, students have their own start and end dates. Statistics show that, at any point in time, the average number of students in the first stage is 3,250; in the second stage 4,530; in the third stage 8,610; and in the fourth stage 6,830. After the fourth stage, 210 students drop out on average (recorded over 15 months), and the remaining students graduate. Note that all drop outs are recorded at the end of the stages. 2 The retention rate at each stage is the proportion of students who finish the stage and move on to the next one or graduate. The retention rates do not only affect revenues but also the university's rankings. The university's president observes the retention rates very closely and takes actions if there are signs of declining retention rates. In the following questions, you should convert all quantities into yearly numbers. (a)[2] Draw a process flow diagram showing how students move through different stages. Make sure to have process boundaries in the diagram. Note that there is no wait time. (b)[1] What is the number of new enrollments every year? (c)[2] What are the yearly dropouts from individual stages? (4 separate dropout numbers) (d)[1] What is the retention rate of Stage 1 ? (\%, 2 decimals, for example 79.54% ) (e)[1] What is the retention rate of Stage 2 ? (\%, 2 decimals) (f)[1] What is the retention rate of Stage 3 ? (%,2 decimals) (g)[1] What is the retention rate of Stage 4 ? (\%, 2 decimals) (h)[1] What is the proportion of newly enrolled students who would eventually graduate? (\%) Note: the retention rates \& graduation rate can be understood as the yield =\#outputs/\#inputs 
Step by Step Solution
There are 3 Steps involved in it
Step: 1

Get Instant Access to Expert-Tailored Solutions
See step-by-step solutions with expert insights and AI powered tools for academic success
Step: 2

Step: 3

Ace Your Homework with AI
Get the answers you need in no time with our AI-driven, step-by-step assistance
Get Started


