Answered step by step
Verified Expert Solution
Link Copied!

Question

1 Approved Answer

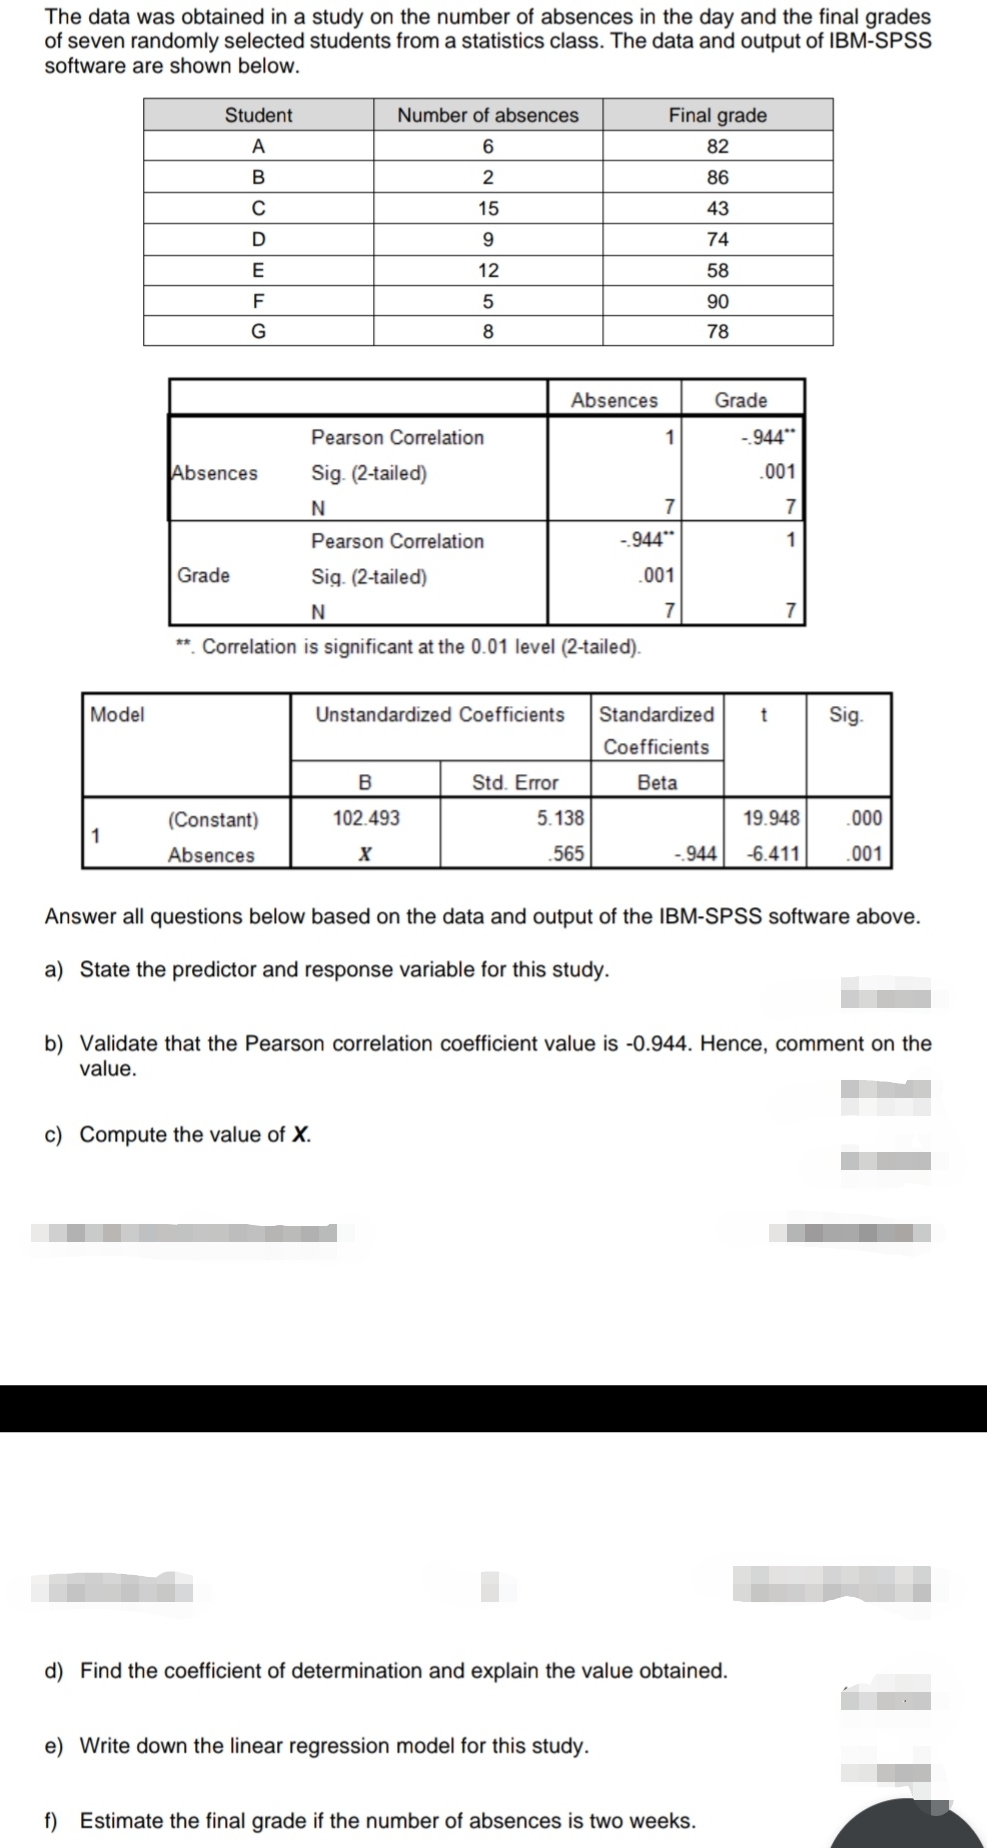
solve and shows solution using formula, not excel or spss The data was obtained in a study on the number of absences in the day

solve and shows solution using formula, not excel or spss

image text in transcribed
The data was obtained in a study on the number of absences in the day and the final grades of seven randomly selected students from a statistics class. The data and output of IBM-SPSS software are shown below. Pearson Correlation Sig. (2-tailed) N Pearson Correlation Sig. (24ailed) N \". Correlation is signicant atthe 0.01 level (2-taiied). Model Unstandardized Coefcients Coefficients \"m 1 (Constant) 102.493 5.138 19.948 .000 Absences X .565 45.411 .001 Answer all questions below based on the data and output of the lBM-SPSS software above. a) State the predictor and response variable for this study. - b) Validate that the Pearson correlation coefficient value is 094-4. Hence. comment on the value. I .'-'*.I c) Compute the value of x. I - I I _ d) Find the coefficient of determination and explain the value obtained. e) Write down the linear regression model for this study. f) Estimate the final grade if the number of absences is two weeks

Step by Step Solution

There are 3 Steps involved in it

Step: 1

blur-text-image

Get Instant Access to Expert-Tailored Solutions

See step-by-step solutions with expert insights and AI powered tools for academic success

Step: 2

blur-text-image

Step: 3

blur-text-image

Ace Your Homework with AI

Get the answers you need in no time with our AI-driven, step-by-step assistance

Get Started

Recommended Textbook for

Trigonometry

Authors: Cynthia Y Young

5th Edition

1119820928, 9781119820925

More Books

Students also viewed these Mathematics questions