Answered step by step
Verified Expert Solution
Link Copied!

Question

1 Approved Answer

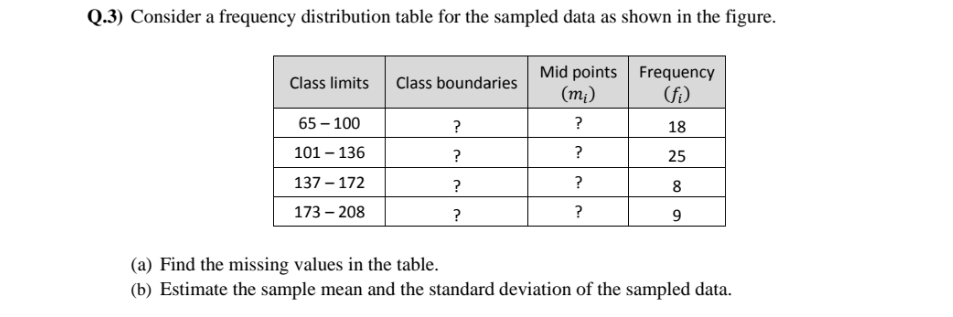
solve as soon as possible Q.3) Consider a frequency distribution table for the sampled data as shown in the figure. Class limits Class boundaries Mid

solve as soon as possible

image text in transcribed
Q.3) Consider a frequency distribution table for the sampled data as shown in the figure. Class limits Class boundaries Mid points Frequency (mi) (fi ) 65- 100 ? ? 18 101 -136 ? 25 137 - 172 ? 8 173 - 208 9 (a) Find the missing values in the table. (b) Estimate the sample mean and the standard deviation of the sampled data

Step by Step Solution

There are 3 Steps involved in it

Step: 1

blur-text-image

Get Instant Access to Expert-Tailored Solutions

See step-by-step solutions with expert insights and AI powered tools for academic success

Step: 2

blur-text-image

Step: 3

blur-text-image

Ace Your Homework with AI

Get the answers you need in no time with our AI-driven, step-by-step assistance

Get Started

Recommended Textbook for

More Books

Students also viewed these Mathematics questions

Question

5.4 Describe how culture can influence self-esteem.

Answered: 1 week ago